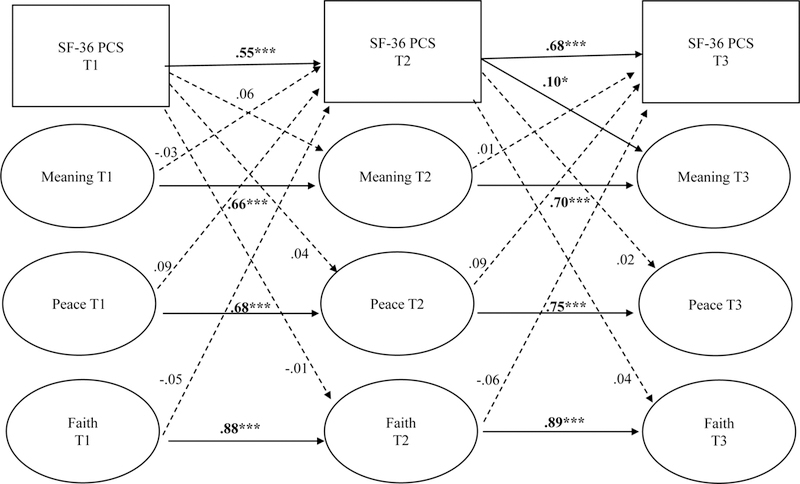
Fig 1.

Cross-lagged structural equation model of the FACIT-Sp subscales (meaning, peace, and faith) and SF-36 PCS. Path coefficients are standardized. All models controlled for age, race, chemotherapy, time since diagnosis, radiation, surgery type, stage, and comorbidity. Dotted lines indicate non-significant paths, while solid lines represent significant paths. For clarity, indicators of the latent variables, error covariances, covariates, and cross-sectional associations are not depicted on the diagram. *p <.05; ***p < 0.001.
