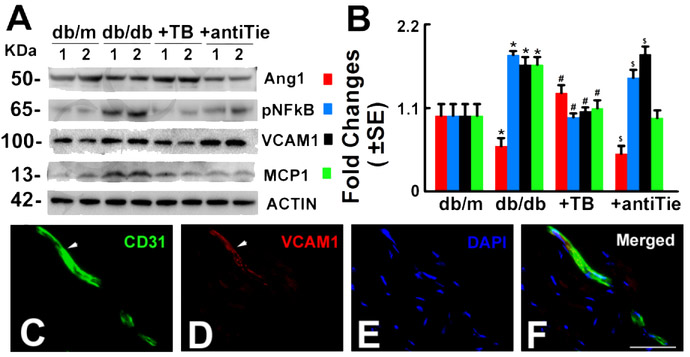
Figure 5: Blockage of Tie2 suppresses Tβ4-downregulated proinflammatory mediators in diabetic mice with peripheral neuropathy.
Panels A and B show Western blot analysis of Ang1 (F=69.31, P<0.0001). p-NFkB (F=475.86, P<0.0001), VCAM1 (F=390.65, P<0.0001) and MCP1 (F=16.05, P=0.0001) levels in the sciatic nerve tissue, β-actin was used as a loading control. n=10/group, One-way ANOVA test. *P<0.01, #P<0.01 and $P<0.05 versus the db/m mice, db/db mice and db/db mice treated with Tβ4, respectively. (Tukey’s Test). db/m=non-diabetic mice treated with vehicle, db/db=diabetic mice treated with vehicle, TB=diabetic mice treated with Tβ4 and vehicle, and antiTie=diabetic mice treated with Tβ4 and the neutralized antibody against Tie2. Double immunofluorescent staining reveals that CD31 positive vessels (C and F green, arrows) immunoreactivity was co-localized with VCAM1 signals (D and F red, arrows). DAPI (E and F, blue) was used as a nuclear counter-staining. Bar=100μm.

