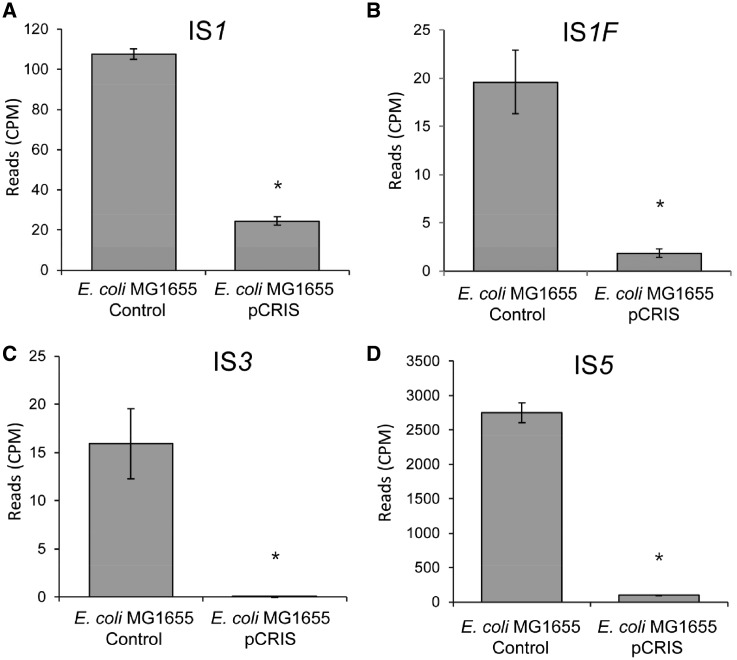
Figure 1.
Transcriptional changes of IS elements in E. coli K-12 MG1655 caused by the propagation of the pCRIS plasmid. The figure displays the frequency of Illumina sequencing reads mapping to IS1 (A), IS1F (B), IS3 (C) and IS5 (D). Star denotes significance (P < 2 × 10⁻⁴) based on t-test. Error bars represent SD, n = 3. CPM, counts per million reads.

