Figure 6.
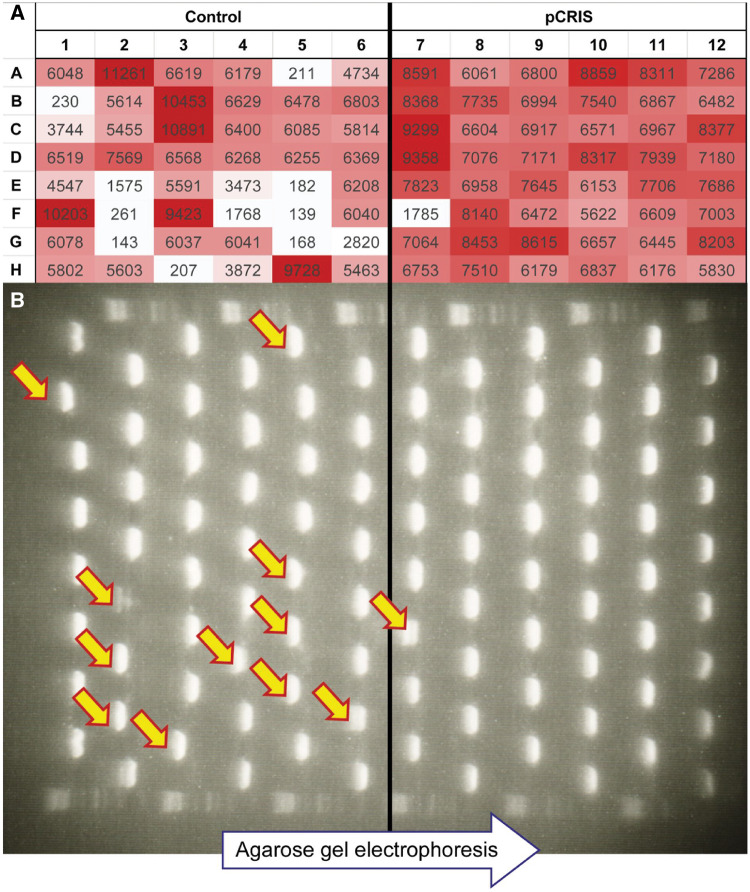
Effect of IS-knockdown on fluorescence of individual cultures. (A) Maximum fluorescence intensities (AU) of the individual cultures in the presence of either an IS-silencing plasmid (pCRIS) or a nontargeting control plasmid (pCRISPathBrick), after 7 days (60 generations) of continuous propagation (T60). (B) Analysis of the mutagenic spectrum within the km-gfp cassette of pBDP_Km_GFP5 from individual cell-populations (n = 48) at T60. Arrows mark PCR products displaying an increased length due to IS transposition into km-gfp.

