Figure 7.
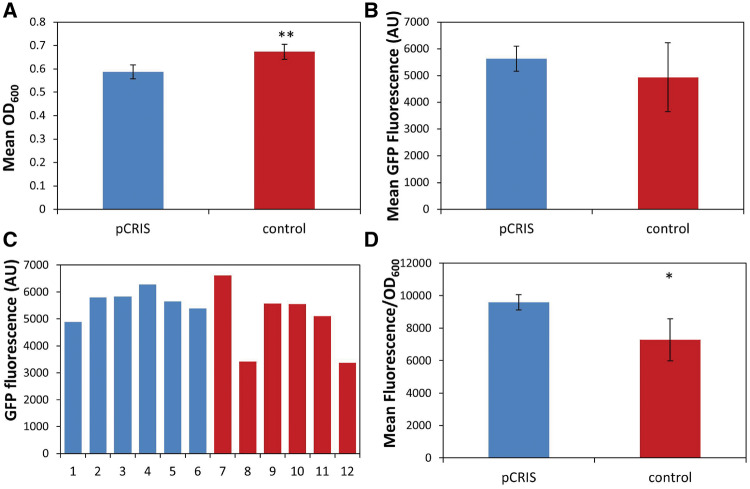
Effect of pCRIS on growth parameters and GFP expression of flask-scale cultures. Six parallels each of E. coli DH5αZ1 carrying plasmid pBDP_Km_GFP5 and either plasmid pCRIS (blue bars) or the nontargeting control plasmid pCRISPathBrick (red bars) was induced with IPTG for 42 h, followed by the endpoint-measurement of OD600 and GFP fluorescence values. (A) Mean OD600 values; (B) Mean GFP fluorescence values; (C) GFP fluorescence measured in each individual flask culture at the end of induction; (D) OD600-normalized fluorescence mean values. Error bars indicate SD (n = 6). Asterisks indicate the results of unpaired, two-tailed t-tests: *P < 0.05, **P < 10−3.

