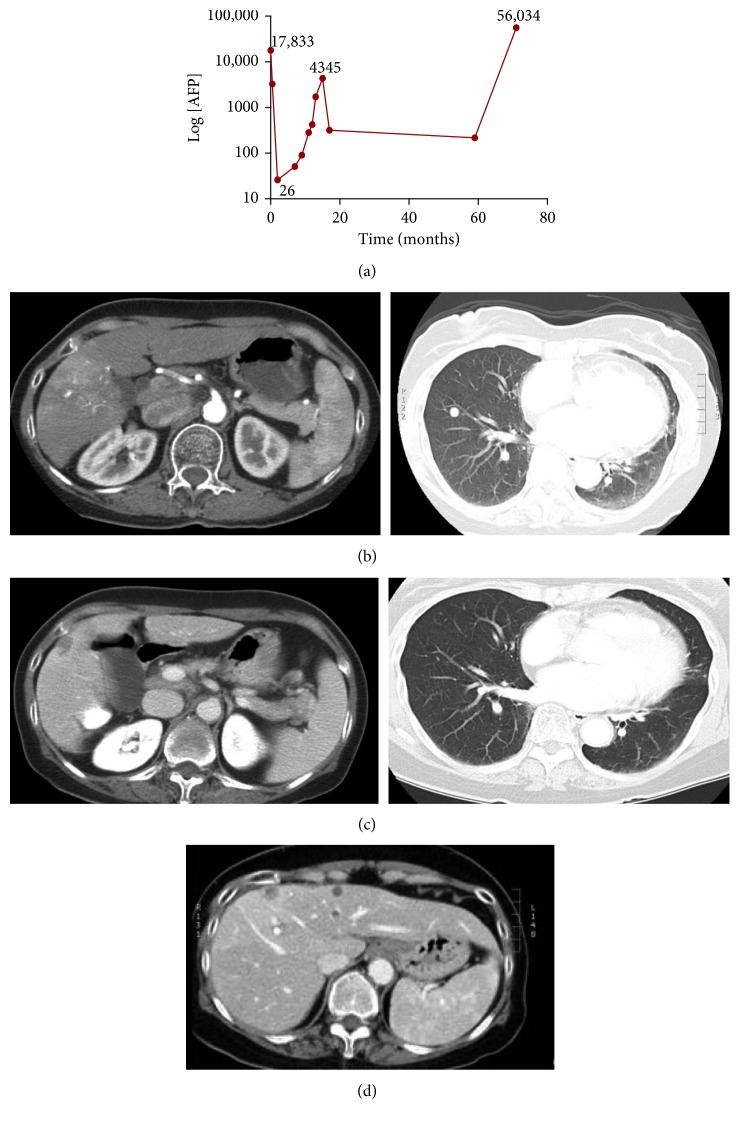
Figure 1.
Spontaneous regression of HCC. (a) Serial changes in AFP levels (expressed as Log 10) over 18 months of follow-up and the time points of CT-scans. (b) A 4 × 4 cm liver lesion and bilateral lung lesions. (b) CT scan two months after diagnosis: the liver lesion has diminished in size (2.5 × 1.5 cm), and the lung lesions are barely visible. (c) CT scan at 17 months. The l liver lesion continues to be stable (now measuring 1.2 × 1.1 cm). (d) Recurrent liver metastases.

