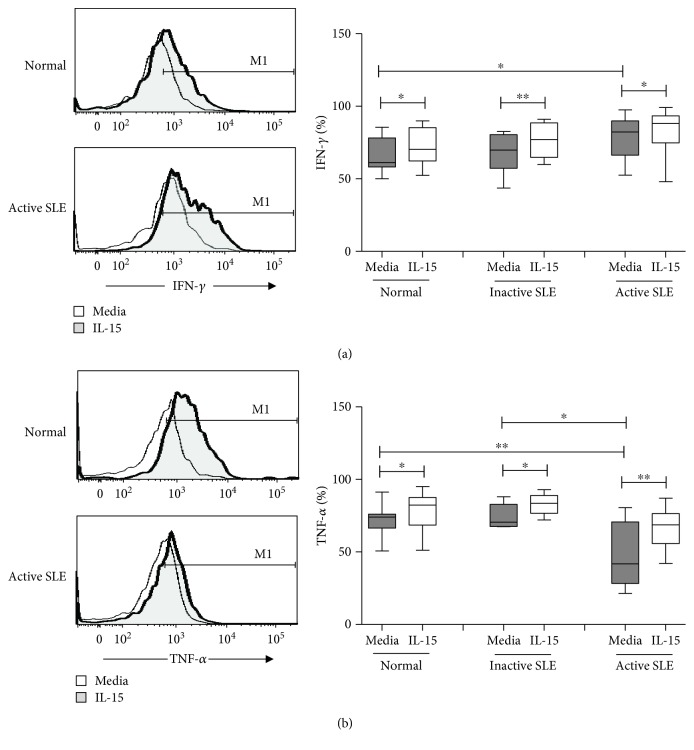
Figure 4.
IFN-γ (a) and TNF-α (b) expression of NK cells from SLE and healthy controls under the influence of IL-15. A representative histogram comparing normal controls (normal) and SLE patients with active disease (active SLE) under the influence of IL-15 is shown (left). Comparison was also made among normal controls (normal), SLE patients with inactive disease (inactive SLE), and SLE patients with active disease (active SLE). PBMC were stimulated with or without IL-15 (10 ng/mL) for 18 hrs. Data was expressed as percent expression (%) ± SEM. ∗ p < 0.05 and ∗∗ p < 0.01 (Normal control, n = 17; SLE with inactive disease, n = 10; SLE with active disease, n = 11).

