Figure 2.

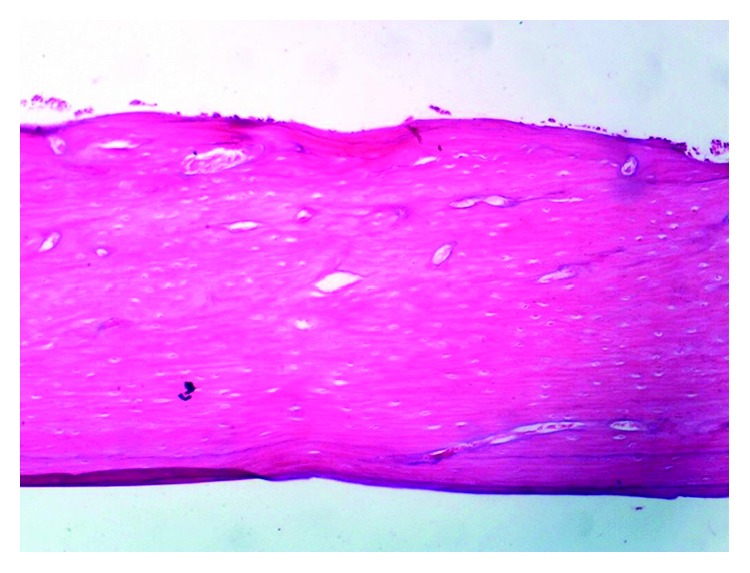
Photomicrograph of bone of rat from the normal control group (C−) showing no histopathological changes. Note. Normal bone cortex (H&E X 100).

Photomicrograph of bone of rat from the normal control group (C−) showing no histopathological changes. Note. Normal bone cortex (H&E X 100).