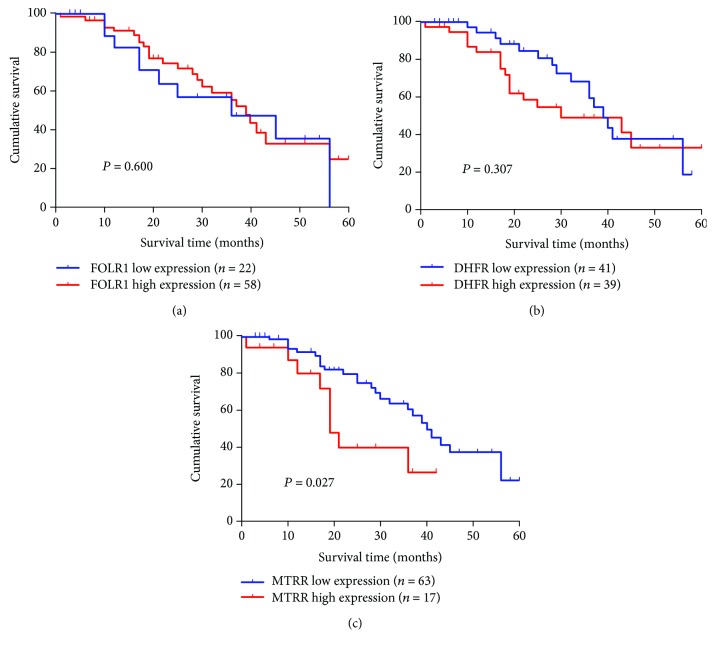
Figure 4.
Survival analysis of 80 OC patients by the Kaplan–Meier method. (a) FOLR1 for survival analysis of OC patients; (b) DHFR for survival analysis of OC patients; (c) MTRR for survival analysis of OC patients. Patients with FOLR, DHFR, and MTRR expression higher or lower than average expression are considered as high or low, respectively.

