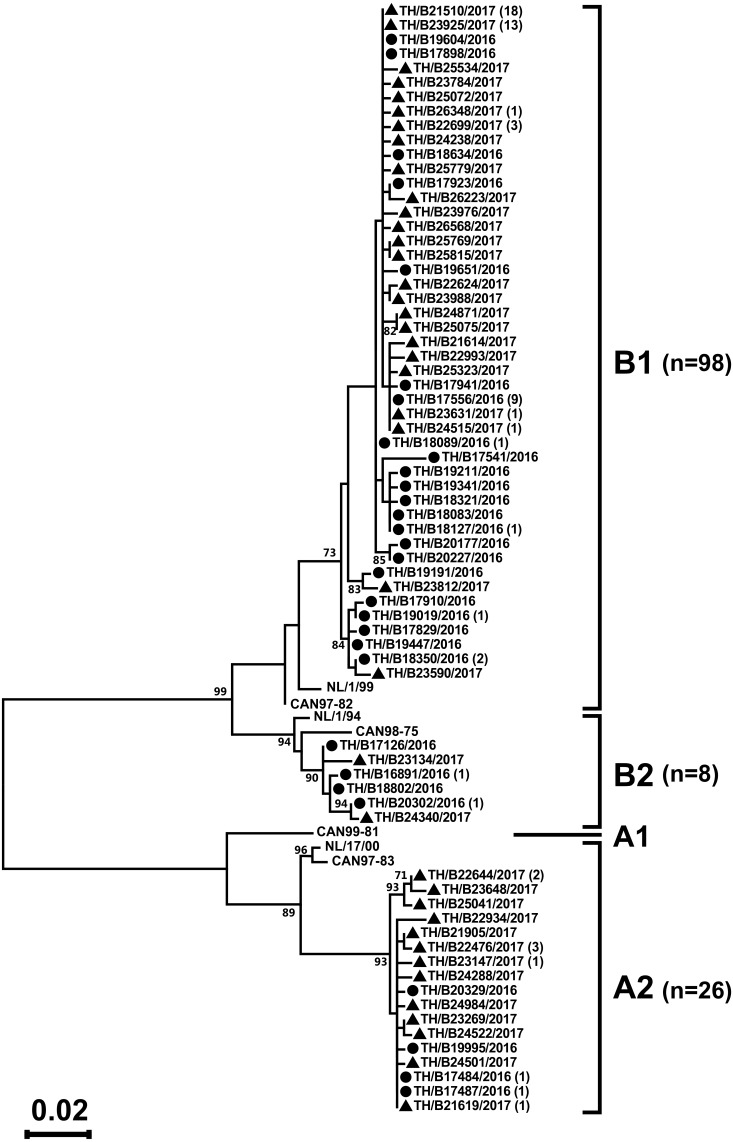
Figure 3. Phylogenetic analysis of hMPV subgroup A and B based on the partial nucleotide sequence of the F gene.
Tree was constructed using the maximum likelihood method and the Tamura–Nei model implemented in the MEGA6. The reliability of the tree was estimated using 1000 bootstrap pseudo-replicates. Bootstrap values >70% are indicated at the branch nodes. Reference sequences for each genotype (A1, A2, B1, and B2) were obtained from GenBank. The scale bar represents the number of nucleotide substitutions per site between close relatives. Circles denote samples from Thailand 2016, while squares indicate strains from Thailand 2017. The number of strains are shown in parentheses.

