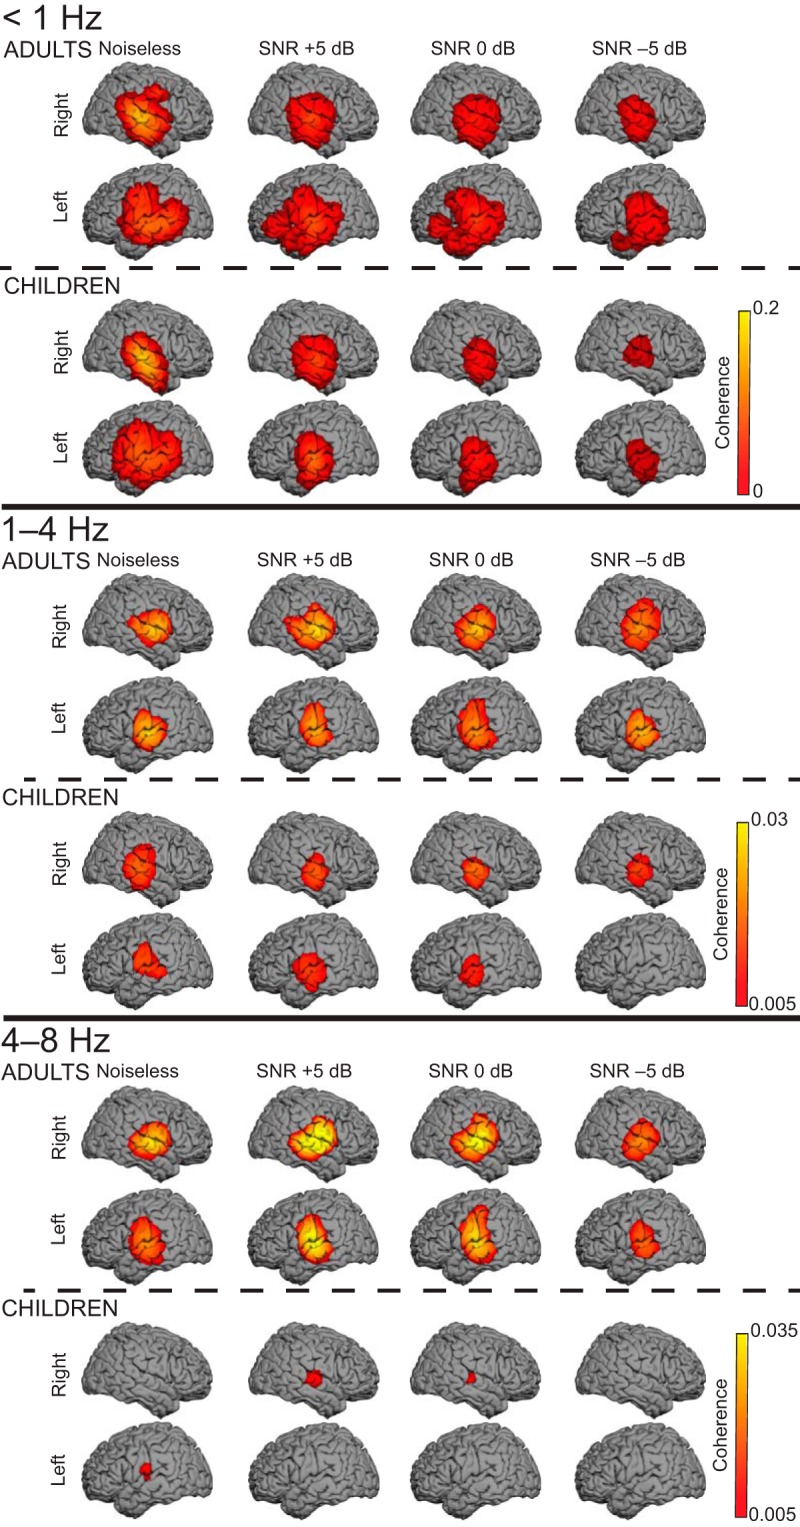
Figure 4.

Cortical tracking of the attended speech stream at <1, 1–4, and 4–8 Hz. The group-level coherence maps (n = 20 in each map) were masked statistically above the significance level (nonparametric permutation statistics). One source distribution is displayed for each possible combination of age group (adults, top; children, bottom) and SNR condition (from left to right: noiseless, and +5, 0, and −5 dB).
