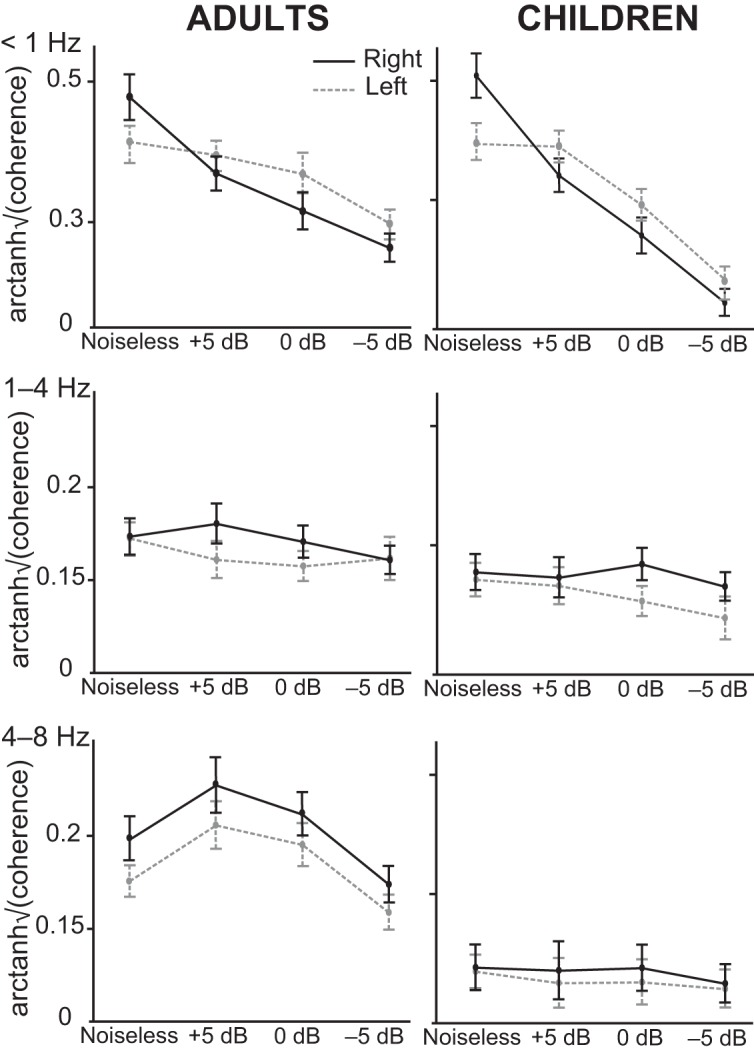
Figure 7.

Illustration of the interaction effects identified on speech brain tracking of the attend speech stream in adults (left column) and children (right column), at <1, 1–4, and 4–8 Hz. Bars indicate the mean and SEM of f-transformed (with f(·) = arctanh ()) coherence values at the right (solid lines) and left (dashed lines) cortical area of peak group-level coherence (superior temporal sulcus at <1 Hz, and supratemporal auditory cortex at 1–4 and 4–8 Hz).
