Figure 3.
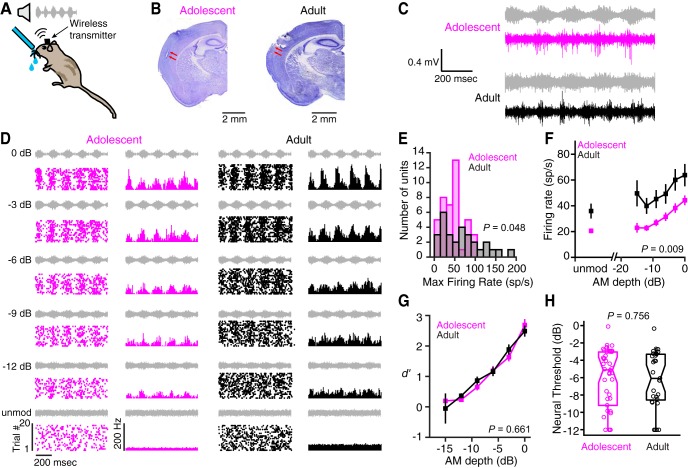
Adolescents display weaker cortical activity than adults. A, Wireless recordings were made from a subset of adolescent and adult animals implanted with chronic electrode arrays. B, Representative Nissl-stained coronal sections from an adolescent and an adult animal are shown. Electrode tracks (red arrows) can be seen in left auditory cortex of both animals. C, Representative raw voltage traces are plotted for an adolescent (subject ID 201700, channel 11) and an adult (subject ID 217821, channel 2), along with the warn stimulus envelopes (adolescent, −6 dB; adult, −12 dB; gray). Both recordings were obtained on day 5 of perceptual training. D, Raster plots (left) and poststimulus time histograms (right) are plotted for two different multiunits (adolescent subject ID 201700, channel 1; adult subject ID 221955, channel 15). Plots are arranged in order of decreasing AM depth. Stimulus envelopes are pictured in gray. The activity depicted here, and for all subsequent panels in this figure, was recorded on the first day of perceptual training. E, The distribution of maximum firing rates are plotted for all adolescent and adult multiunits. For this, and all subsequent panels in this figure, the number of units (animals) are as follows: adolescent, 42 (5); adult, 29 (4). F, Adolescent and adult firing rates are plotted as a function of AM depth. Data are the mean ± SEM. G, Adolescent and adult firing rates were transformed into d′ values and plotted as a function of AM depth. Data are the mean ± SEM. H, Thresholds for individual multiunits or single units (circles) are plotted as a function of age group for the first day of perceptual training. Horizontal lines represent medians, boxes represent the 25th and 75th percentiles, and whiskers represent the 5th and 95th percentiles. unmod, Unmodulated noise; Max, maximum; sp/s, Spikes per second.

