Figure 4.

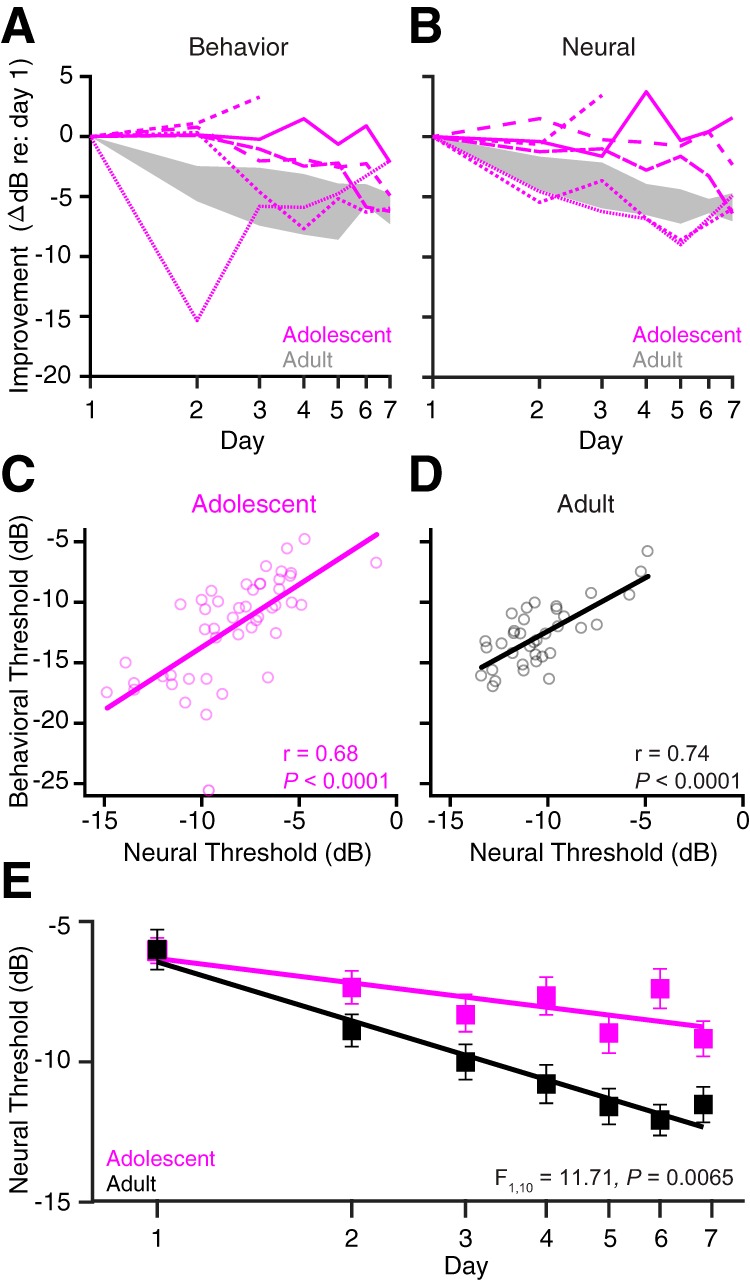
Adolescents display slower improvements in cortical sensitivity compared with adults. A, Behavioral improvement (i.e., the change in threshold relative to day 1) is plotted for each individual adolescent animal implanted with a chronic electrode (pink lines) as a function of the perceptual training day. The gray shaded region represents the full range of behavioral improvement in adult implanted animals. B, Cortical thresholds were averaged across individual multiunits and single units within an animal. Neural improvement was calculated as the change in the average neural threshold relative to day 1. Data from the same animal are depicted with identical line styles in A and B. The gray shaded region represents the full range of adult neural improvement. C, Each circle represents the average neural threshold recorded in a given animal during a single training session, plotted against the behavioral threshold of the animal from that same training session. Neural and behavioral thresholds were highly correlated within adolescent animals. D, Same as C, but for adults. E, Neural thresholds were averaged across all animals in a given age group and plotted as a function of the log of the perceptual training day. For the number of units and subjects recorded from on each day, see Table 2.
