
Figure 6.
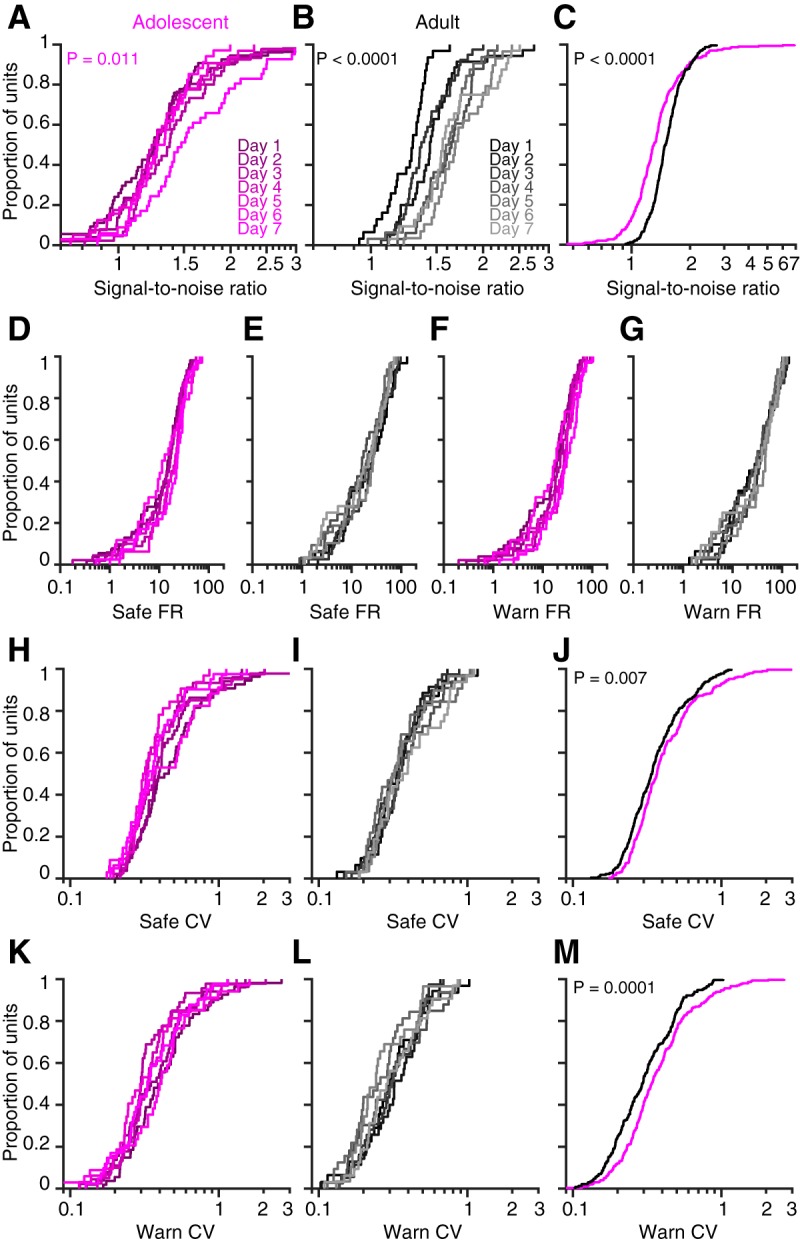
Adolescent neurons display increased trial-to-trial variability and poorer signal-to-noise ratios. A, B, Signal-to-noise ratios were calculated for individual multiunits and single units by dividing the mean firing rate evoked by a moderate warn stimulus (−9 dB AM) by the mean firing rate evoked by the safe (unmodulated noise) stimulus. A value of 1 indicates that the unit responded identically to safe and warn stimuli; values >1 indicate greater separation between the two responses. The cumulative distribution of signal-to-noise ratios for the adolescent (A) and the adult (B) neural population is plotted for each perceptual training day. C, The distribution of signal-to-noise ratios is plotted for each age group, collapsed across training sessions. D–G, Cumulative distributions for safe-evoked (D, E) and warn-evoked (F, G) firing rates (FRs) in adolescents (D, F) and adults (E, G) are plotted for each day of perceptual training. H, I, Cumulative distributions for safe-evoked CV values for the adolescent (H) and adult (I) neural population are plotted for each day of perceptual training. J, The safe-evoked CV is plotted for each age group, collapsed across training sessions. K, L, Cumulative distributions for warn-evoked CV values for the adolescent (K) and adult (L) neural populations are plotted for each day of perceptual training. M, The warn-evoked CV is plotted for each age group, collapsed across training sessions. For the number of units and animals recorded from each day and represented in A, B, D–I, K, L, see Table 2. For C, J, and M, the number of units (animals) contributing to the analysis are as follows: adolescent, 297 (6); adult, 231 (4). B, E, G, I, and L were originally published in a similar form in the study by Caras and Sanes (2017).