Figure 2.
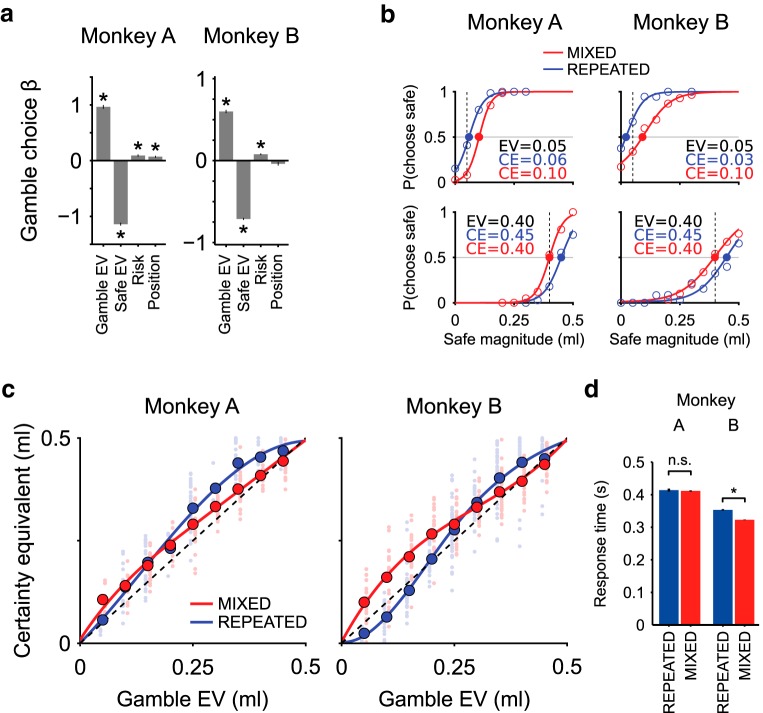
Basic choice behavior and estimation of CEs. a, Logistic regression of choice behavior. Four task variables (gamble EV, safe EV [magnitude], risk variance, gamble position) were used as regressors for the gamble choice. Positive standardized coefficients for gamble EV and risk indicated that monkeys preferred gambles with higher EV to gambles with lower EV, and more risky gambles to less risky ones. Negative coefficient for safe EV confirmed that monkeys preferred higher reward magnitudes to lower ones. The positive position factor for 1 monkey indicated a side bias, which was taken into account by repeating all choice pairs with inverted left-right positions.* Significant regression coefficient (one-sample t test). b, Psychometric estimation of CEs. CEs of two example gambles with probabilities 0.1 (top) and 0.8 (bottom), estimated in the two different elicitation sequences: MIXED (red) and REPEATED (blue) sequences. The percentages of safe choices as a function of safe magnitude (circles) were fitted to softmax functions (curves). Vertical lines indicate the gambles EVs (dashed lines). Filled circles represent the CEs. In both monkeys, low probability gambles (top) had a lower CE in the REPEATED condition than in the MIXED condition, where the CEs were consistently higher than the EVs, indicating risk seeking behavior. High probability gambles (bottom) showed the inverse pattern, indicating risk seeking behavior only in the REPEATED condition. c, Pattern of CEs across the two elicitation sequences (MIXED vs REPEATED). Single session CEs (small data points) and average CEs across sessions (large data points) plotted as a function of gamble EV, with cubic spline interpolated curves. The full pattern of CEs shows a smooth transition from low to high probability gambles in terms of CE difference across the two elicitation sequences. For low probability gambles, both monkeys showed higher CEs in the MIXED than in the REPEATED conditions; when increasing gamble probabilities, the CE difference across conditions gradually reduced and inverted, resulting in lower CEs in the MIXED than in the REPEATED condition for high reward probabilities. Single session data points were shifted horizontally (REPEATED condition: left; MIXED condition: right) for visualization purposes. d, Mean RT (± SEM across sessions) in the two elicitation conditions. RTs for Monkey A were similar in the two conditions (RT difference = 3.0 ms, t(9088) = −0.59, p = 0.56); Monkey B showed faster response in the MIXED condition compared with the REPEATED condition (RT difference = 30.0 ms, t(22233) = −15.88, p = 1.77 × 10−56) (for RT as a function of the options' EV, see Figure 2-1). *Significant RT difference between conditions (two-sample t test).

