Figure 6.
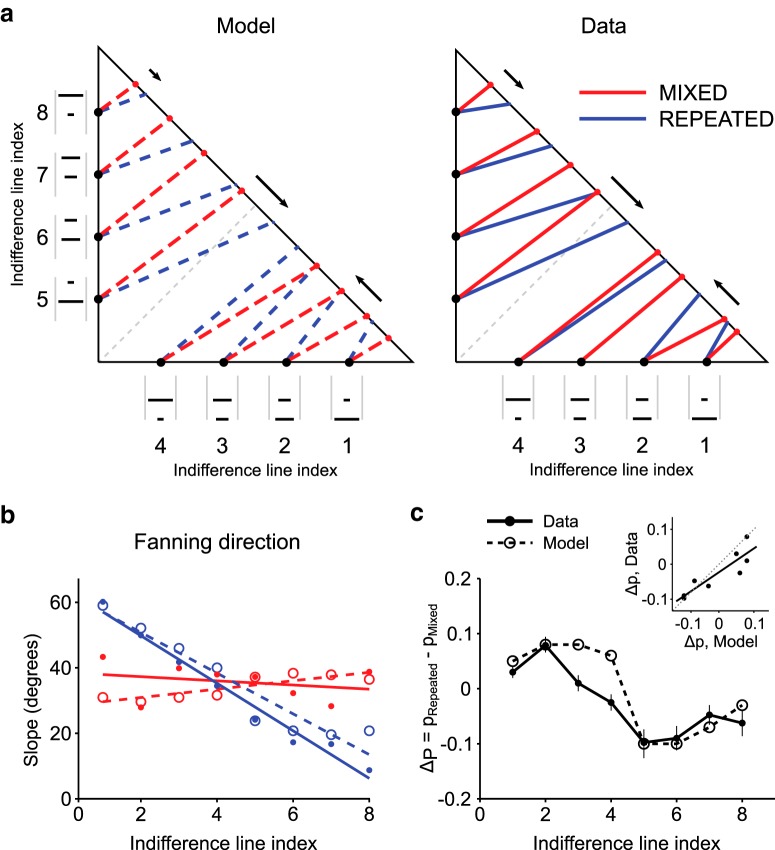
Effect of CE elicitation sequences on the Marschak–Machina triangle indifference lines. a, Modeled (left) and measured (right) patterns of indifference lines across conditions. Arrows indicate the direction and amount of shift for three sample indifference points between the MIXED (red) and REPEATED (blue) conditions, highlighting how the model correctly predicted the effect of condition change. Gray line connects points with the same EV (0.25 ml), representing an indifference line in case of risk-neutral behavior. Numbers define indices for the indifference lines, corresponding to fixed gambles on the triangle edges (black dots, also represented as visual cues). b, Fanning direction of the indifference lines. Points represent the slope of indifference lines (angle between each line and the horizontal axis) as a function of indifference line index. Circles represent the model predicted values. Dots represent experimental data. Lines indicate linear regressions, separately computed on the two task conditions for the model (dashed lines) and the data points (continuous lines). A regression line with negative slope corresponds to a decrease in indifference line angle, indicating fanning-out; conversely, a positive regression coefficient indicates fanning-in of indifference lines. c, Statistical comparison between model and experimental data. Shift in location of indifference points across elicitation sequences (average difference ± SEM). A linear regression between the modeled and measured shifts (inset) confirmed the match between model and data in terms of predicted shift in indifference points, corresponding to a correct prediction of the change in the fanning direction across conditions.

