
Figure 2.
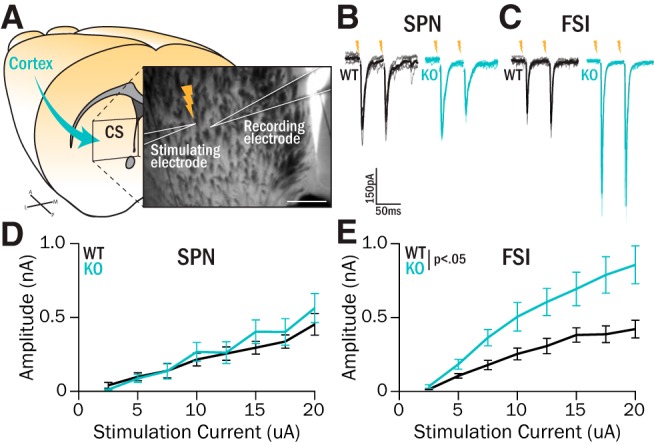
Excitatory drive to central striatum FSIs is increased in Sapap3-KOs. A, Nonspecific excitatory inputs from cortex were activated using intrastriatal stimulation while recording nearby cells in central striatum. Scale bar, 200 μm. B, C, Synaptic responses were evoked by passing current pulses (0.1 ms) through the stimulating electrode during whole-cell recordings of SPNs (B) or FSIs (C) in Sapap3-KOs and WT littermates. D, Evoked response I-O curves in SPNs were not different in KOs versus WTs (WTs: 8 animals, 14 cells; KOs: 6 animals, 12 cells; F(1) = 0.016, p = 0.90, ANOVA). At maximum stimulation intensity (20 μA), EPSC sizes were not different between WTs and KOs (Z = −0.75, p = 0.45, WRST). E, Evoked responses in FSIs were significantly greater in KOs relative to WTs (WTs: 6 animals, 13 cells; KOs: 6 animals, 12 cells; genotype, F(1) = 8.11, p = 0.014; interaction, F(7) = 4.05, p = 0.023, ANOVA). At maximum stimulation intensity (20 μA), KOs displayed significantly larger EPSCs (rank sum = 57, p = 0.0057, WRST).