Figure 4.

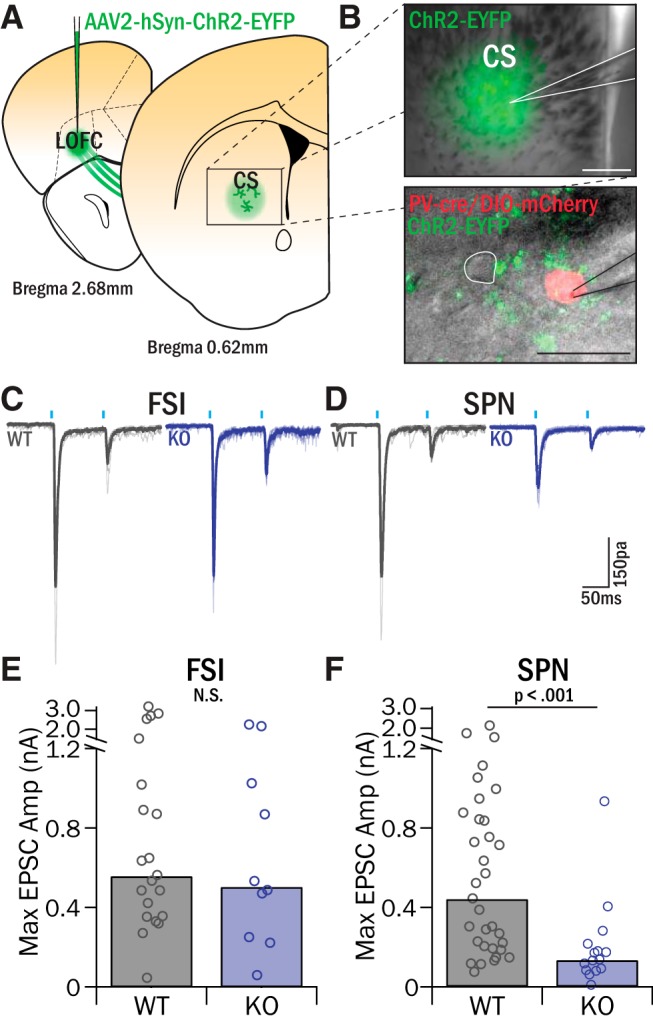
LOFC inputs to SPNs have reduced amplitude in Sapap3-KOs, whereas inputs to FSIs are unchanged. A, AAV2-hSyn-ChR2-EYFP was injected into LOFC to selectively identify LOFC projections in central striatum. B, Top, Recordings were targeted to the EYFP-labeled LOFC projection zone in central striatum. Scale bar, 200 μm. Bottom, Whole-cell patch voltage-clamp recordings (Vhold = −80 mV) were conducted in FSIs (identified by the presence of mCherry) and nearby SPNs (white outline). Scale bar, 25 μm. C, D, Brief pulses of light (1 mW, 10 ms pulse, 100 ms IPI) filtered at 470 nm and delivered through the 60× microscope objective-evoked synaptic release from ChR2-infected LOFC terminals, and the resulting EPSCs were recorded in FSIs (C) and SPNs (D) and compared between Sapap3-KOs and WT littermates. E, LOFC-evoked EPSCs in FSIs were no different in KOs and WTs (WT: 563.38 pA, IQR = 661.69 pA, 5 animals, 10 cells; KO: 509.81 pA, IQR = 680.86 pA, 10 animals, 21 cells; Z = 0.57, p = 0.57, WRST). F, SPNs in central striatum had significantly smaller LOFC-evoked EPSCs in KOs relative to WTs (WT: 444.84 pA, IQR = 637.43 pA, 12 animals, 33 cells; KO: 137.92 pA, IQR = 110.20 pA, 3 animals, 15 cells; Z = 3.43, p = 6.14 × 10⁻⁴, WRST).
