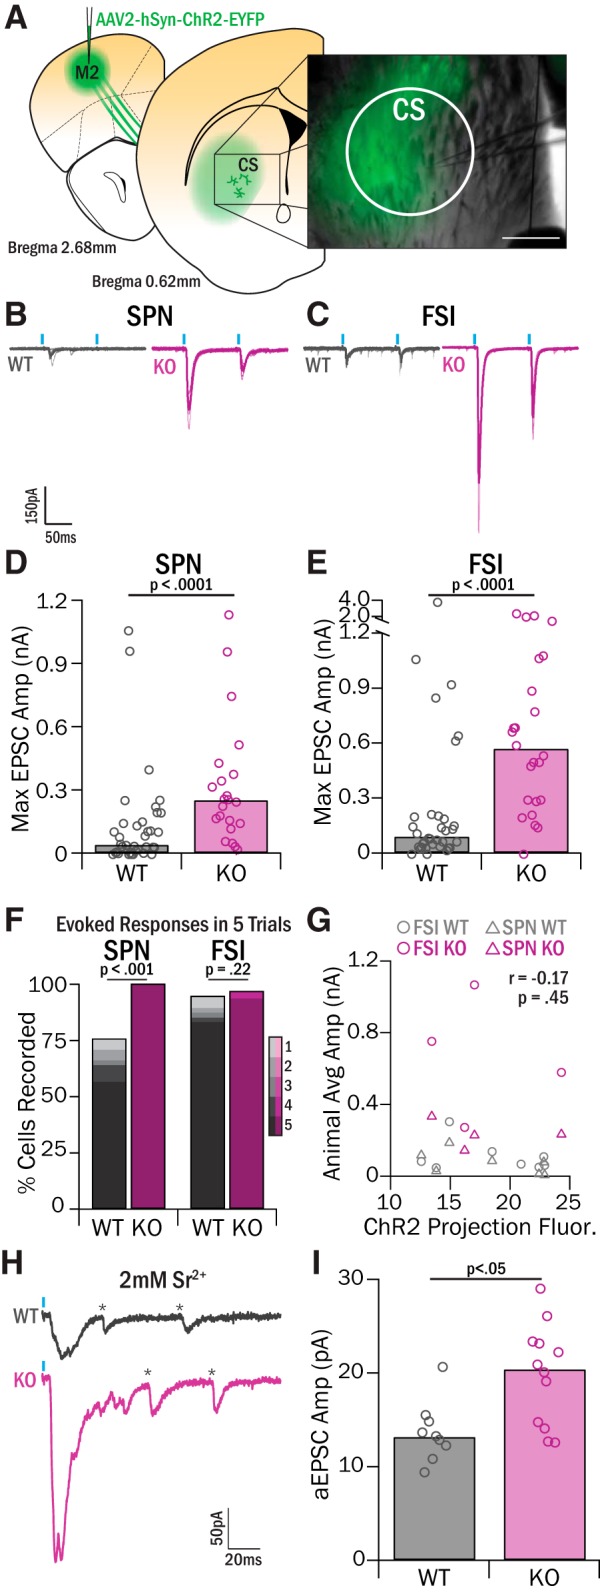
Figure 5.

M2 input to CS is increased in Sapap3-KOs. A, AAV2-hSyn-ChR2-EYFP was injected into M2 to selectively label M2 projections in central striatum. Recordings were targeted to the central striatum region, which included the medial portion of the EYFP-labeled M2 projection zone. Scale bar, 200 μm. B, C, Brief pulses of 470 nm light (1 mW, 10 ms pulse, 100 ms IPI) evoked synaptic release from ChR2-infected M2 terminals, and the resulting EPSCs were recorded in SPNs (B) and FSIs (C) in Sapap3-KOs and WT littermates. D, SPNs in the central striatum of KOs had significantly greater EPSC amplitudes than WTs (WT: 42.58 pA, IQR = 136.36 pA, 15 animals, 37 cells; KO: 254.28 pA, IQR = 221.90 pA, 7 animals, 22 cells; Z = −3.87, p = 1.11 × 10⁻⁴, WRST). E, FSIs in central striatum of KOs had significantly greater EPSC amplitudes than WTs (WT: 85.81 pA, IQR = 158.33 pA, 15 animals, 34 cells; KO: 564.65 pA, IQR = 640.84 pA, 8 animals, 24 cells; Z = −4.22, p = 2.44 × 10⁻⁵, WRST). F, Response reliability for each cell was assessed by quantifying the number of optically evoked responses in five trials of stimulation. SPN mean response reliability was significantly increased in KOs relative to WTs (WT 65.41%, SEM = 7.17%; KO 100%; Z = −2.93, p = 0.0034, WRST). FSI mean response reliability was greater in KOs, but not significantly (WT 85.88%, SEM = 5.31%; KO 95, SEM = 4.21%; Z = −0.93, p = 0.22, WRST). G, Average fluorescence intensity of ChR2-infected M2 projections was calculated and correlated with the overall average amplitude of EPSCs recorded in FSIs (10 WTs, 4 KOs) and SPNs (9 WTs, 4 KOs) in a given animal. There was not a significant correlation (r = −0.17, p = 0.45, Pearson's R). H, Example traces of strontium aEPSC events in WT and KO SPNs. *Detected aEPSC events. I, SPNs in KO mice showed significantly greater aEPSCs relative to WT mice (WT = 13.25 pA, IQR = 2.27 pA, 2 mice, 9 cells; KO = 20.48 pA, IQR = 8.59 pA, 3 mice, 12 cells; Z = −2.38, p = 0.02, WRST).
