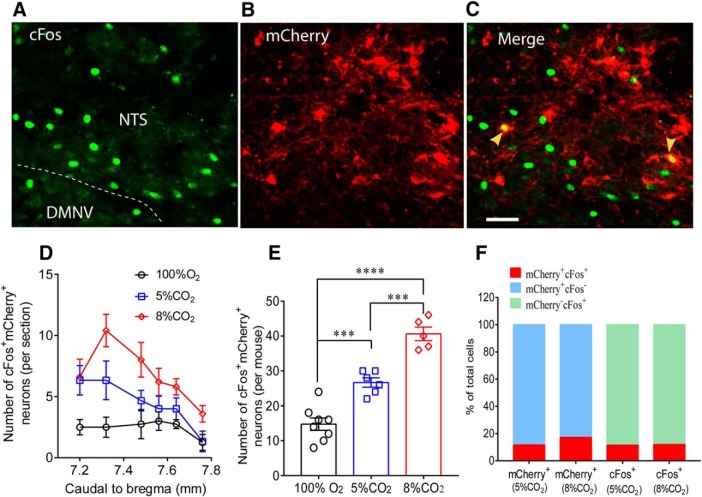
Figure 6.
CO2 sensitivity of Phox2b-expressing neurons. A–C, Immunofluorescence images showing expression of cFos and mCherry. The mouse was exposed to 8% CO2 for 50 min before immunohistological experiments. CO2-activated neurons were denoted by the immunoreactivity for cFos (green, A). The cFos+mCherry+ neurons (denoted by arrows, C) represented CO2-activated transduced neurons. Scale bar, 25 μm. D, Rostrocaudal distribution of cFos+mCherry+ neurons in 6 coronary sections from each mouse exposed to different concentrations of CO2. Number of mice: n = 8 for 100% O2; n = 6 for 5% CO2; n = 5 for 8% CO2. E, Comparisons in the average number of cFos+mCherry+ neurons of each group based on cell counts in D. F, Proportion of cFos+mCherry+ neurons in the total number of mCherry+ or cFos+ neurons. The calculations were made based on cell counts in E. ***p < 0.001 (one-way ANOVA with Tukey's test). ****p < 0.0001 (one-way ANOVA with Tukey's test).

