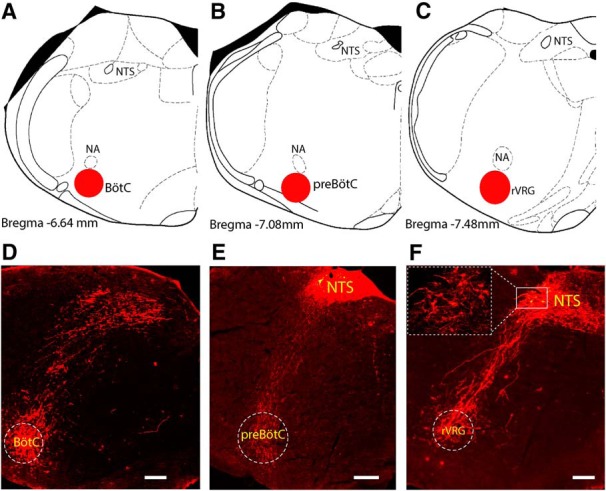
Figure 8.

Projection of Phox2b-expressing neurons to the rCPG. A–C, Schematic profile illustrating the location of BötC (A), preBötC (B), and rVRG (C) in brainstem coronary sections. D–F, Photomicrographs showing the projection of mCherry-transduced neurons to the ventrolateral medulla, approximately corresponding to BötC (D), preBötC (E), and rVRG (F). The details in lined rectangle were enlarged in a dashed rectangle in F. Scale bar, 200 μm.
