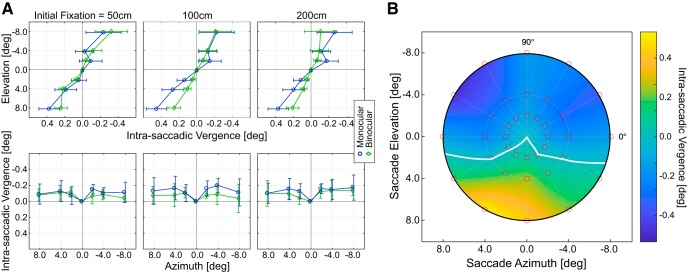
Figure 6.
Intrasaccadic vergence across subjects, and fixation distances, and for monocular and binocular viewing. A, Horizontal intrasaccadic vergence for vertical and horizontal saccades. Left to right, Data for initial fixation distances of 50, 100, and 200 cm averaged across trials and subjects. Top, Data for vertical saccades. Bottom, Data for horizontal saccades. The means (solid lines) and SDs (error bars) are plotted as a function of elevation or azimuth. Green symbols and lines represent the data for binocular viewing. Blue symbols and lines represent the data for monocular viewing. B, Intrasaccadic vergence across the central visual field. Initial fixation distance was 100 cm. Monocular condition. The abscissa and ordinate indicate the horizontal and vertical eccentricity, respectively, of the saccadic target. Median horizontal vergence is represented by color: Lighter colors represent more positive values. White curve indicates where vergence changes sign from convergent to divergent. Red dots represent the tested field positions. The heat map was obtained via natural neighborhood interpolation (Sibson, 1981).

