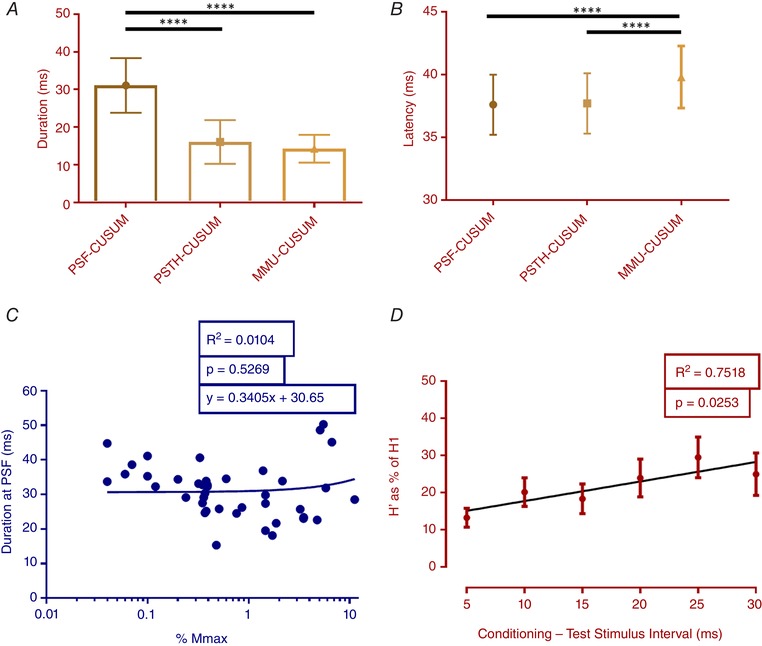
Figure 2. Overview of the RI properties.

Top: mean duration (A) and latency (B) of all 54 units that were obtained using different analysis methods. Here, the longest duration was obtained at PSF‐CUSUM, whereas the longest latency was recorded in MMU‐CUSUM. Error bars show the SD. **** P < 0.0001. Bottom: effect of the stimulus strength on the duration of inhibition (C) determined using PSF‐CUSUM. Note insignificant regression in (C), which was plotted using a logarithmic abscissa. D, RI by paired H‐reflex protocol was assessed using various conditioning (H1) and test (H') stimulus intervals. Error bars represent the SE. [Color figure can be viewed at wileyonlinelibrary.com]
