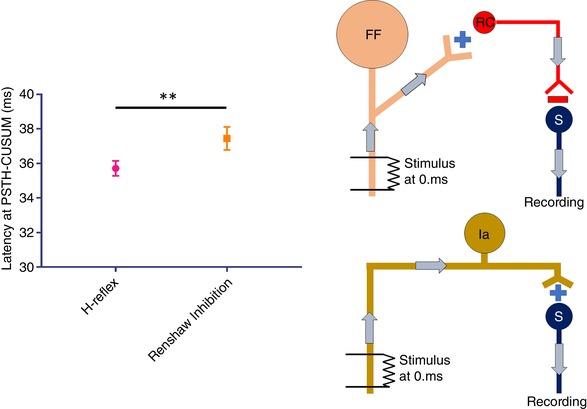
Figure 3. The latency difference between the RI and H‐reflex together with their proposed circuitries.

Significantly longer latency of RI compared to H‐reflex is shown on the left, whereas the wiring diagram of RI and H‐reflex is shown on the right. Top right: schematic of the larger MN (FF) stimulation and consecutive RI on smaller MN (S) by RC. Bottom right: primary afferent (Ia) stimulation to evoke H‐reflex. Error bars represent the SD. ** P < 0.01. [Color figure can be viewed at wileyonlinelibrary.com]
