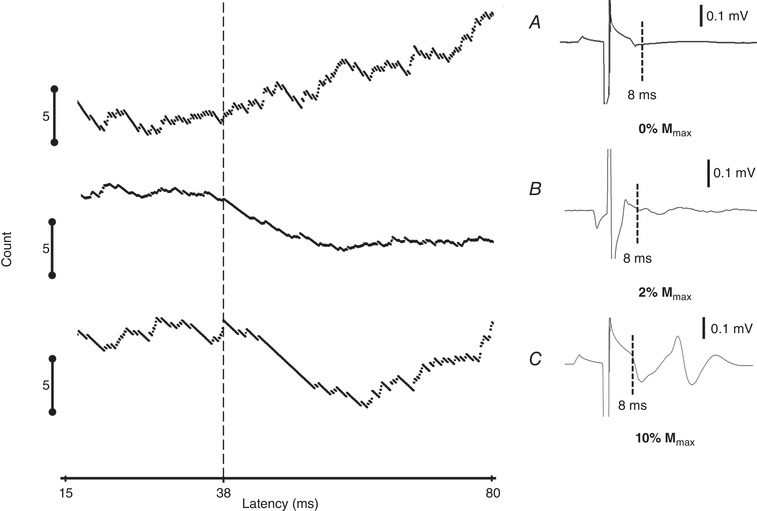
Figure 7. The effect of the M‐response on the proposed inhibition.

Left: PSTH‐CUSUMs at three different stimulus intensities. Right: averaged SEMG traces. The stimulus intensity just below the M‐response threshold did not result in an M‐response and hence did not produce an inhibition (A), whereas the other two stimulus intensities, 2% (B) and 10% M max (C), resulted in increased inhibition with a latency of ∼38 ms.
