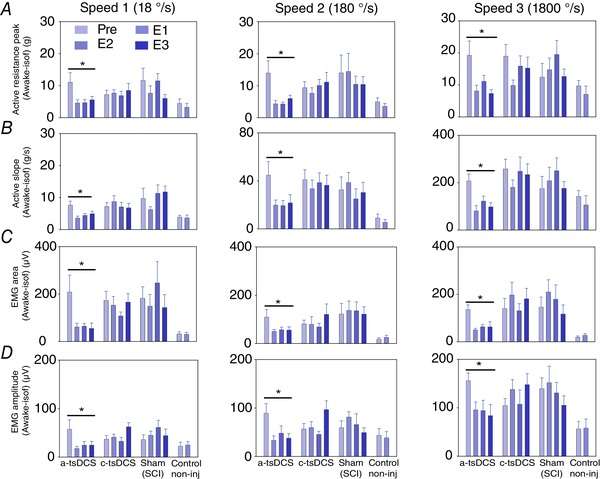
Figure 2. Repeated treatment with a‐tsDCS results in long‐term reduction of spasticity in mice with SCI.

Animals were divided into four groups: an a‐tsDCS group (n = 16); a cathodal‐tsDCS group (n = 15); a sham‐treated group (n = 10); and a non‐injured control group (n = 8). A–C, a‐tsDCS caused a significant reduction in peak muscle resistance (A), rising slope (B), EMG area (C) and EMG amplitude (D). B–D, cathodal and sham treatments did not significantly differ. * P < 0.05, Holm–Sidak method. Pre, pre‐evaluation performed prior to the start of tsDCS or sham treatment; E1, first evaluation immediately performed after the end of 7 day tsDCS or sham treatment; E2, second evaluation performed 2 weeks post tsDCS or sham treatment; E3, third evaluation performed 4 weeks post tsDCS or sham treatment. Note time is relative to tsDCS and not to SCI. E1 and E2 for non‐injured control animals are the first and second evaluations, no treatment. Data are presented as the mean ± SEM. [Color figure can be viewed at wileyonlinelibrary.com]
