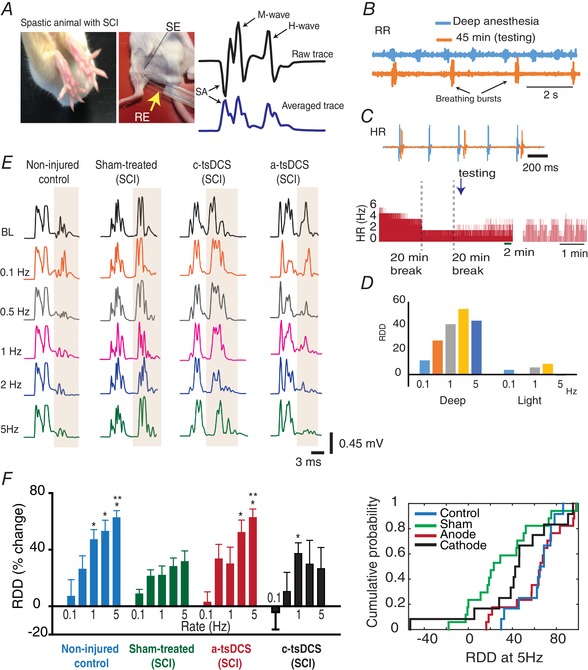
Figure 5. RDD of the Hoffman reflex after repeated sessions of tsDCS stimulation.

A, left: observable characteristics of spasticity (fanning of toes) in an animal with SCI; right: recording set‐up: SE, stimulating electrode; RE, recording electrode; SA, stimulus artefact. The two recording traces shown at the far right represent a raw trace (top) and the root‐mean square calculated trace (bottom). B, respiratory rate (RR) during deep anaesthesia (blue) and 45 min after an anaesthetic injection (orange) are shown. C, top: heart rate (HR) during deep anaesthesia (blue) and 45 min after an anaesthetic injection (orange) are shown; bottom: full recording, with breaks, showing the HR at which RDD testing took place. D, changes that occurred when RDD was tested during deep anaesthesia (Deep) vs. light anaesthesia (Light). E, left: representative recordings from the groups indicated. F, left: average RDD for the groups indicated. RDD was significantly higher in the control group (n = 12) for rates 1–5 Hz compared to rate 0.1 Hz (P < 0.001); right: cumulative probability distribution of the groups indicated for RDD at 5 Hz. *Significant difference from RDD at 0.1 Hz in the same group; **Significant compared to respective RDD in the sham group. Data are presented as the mean ± SEM. [Color figure can be viewed at wileyonlinelibrary.com]
