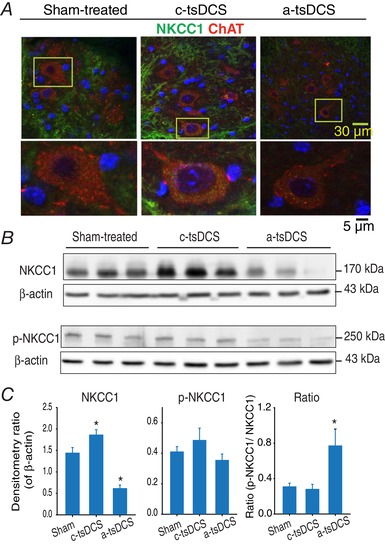
Figure 7. NKCC1 and p‐NKCC1 expression following one stimulation session in intact mice.

A, confocal images of spinal motor neurons stained for NKCC1 (green) and ChAT (red). Motor neurons showed an increase and decrease in NKCC1 after cathodal and a‐tsDCS respectively. B, western blots performed for samples collected 2.5 h after stimulation to detect NKCC1 and p‐NKCC1. Higher levels and lower levels of NKCC1 were detected after cathodal vs. anodal stimulation, respectively, compared to the Sham samples. Detection of β‐actin was included as a loading control. C, band density data from (A), including calculations of p‐NKCC1/total NKCC1 ratios. * P < 0.05. Data are presented as the mean ± SEM. [Color figure can be viewed at wileyonlinelibrary.com]
