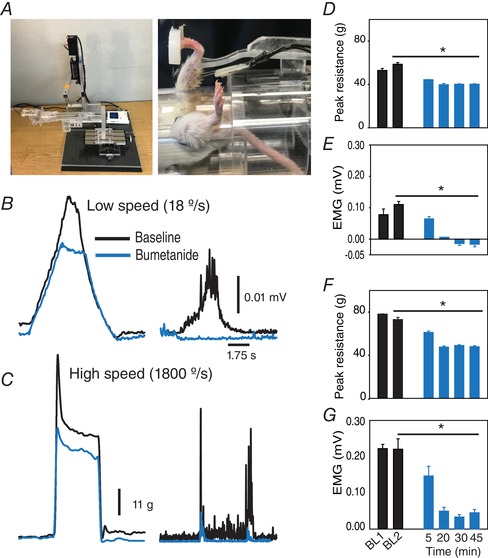
Figure 9. The NKCC1 blocker, bumetanide, reduced spasticity in animals with SCI.

A, photographs of a stretch apparatus and mouse holder used to perform these experiments. Note that this apparatus is a modified version from the device in Figure 1. B and C, representative traces of muscle resistance (left) and concurrent EMG (right) at low speed (B) and high speed (C). D–G, decreases in muscle resistance and concurrent EMG at low speed and high speed, respectively, in each case, following bumetanide injection (n = 9 mice). The negative values of EMG indicate stretches caused depression of EMG relative to background activity prior to stretching. Data are presented as mean ± SEM. * P < 0.05 compared to baseline 2 [BL2 was measured 5 min following the first baseline (BL1)]. [Color figure can be viewed at wileyonlinelibrary.com]
