
Figure 7. Activation of GABABRs decreases eIPSC amplitudes at MNTB–LSO synapses.
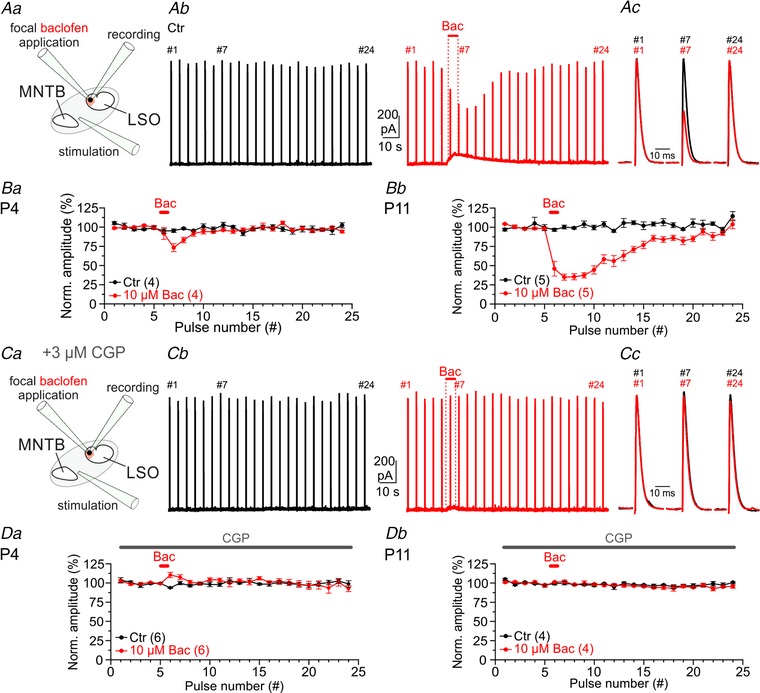
Aa, scheme of the experimental set‐up. Ab, MNTB fibre stimulation at P11 (24 pulses, 0.2 Hz) in control (Ctr, black) and focal baclofen application (10 μM Bac, 5 s, red). Traces are averages of three repeats. Ac, close ups of eIPSCs at the pulse no. 1, 7 and 24 also denoted in Ab. B, quantification of normalized eIPSC amplitudes (mean of first five pulses set to 100%) at P4 (Ba) and P11 (Bb). BC and D, same as A and B, but in the presence of bath‐applied 3 μM CGP.