
Figure 3. Intense rhythmic activation of both PV and SST interneurons during the pre‐ictal period.
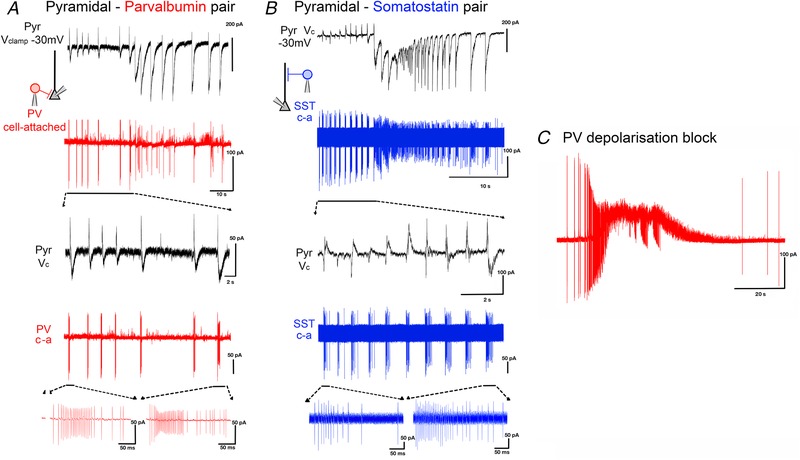
A, paired recording of a pyramidal cell (black trace: V clamp at −30mV) and a cell attached (‘c‐a’) recording of a PV interneuron (red trace) during a propagating ictal event. B, equivalent paired recording of a pyramidal cell and a SST interneuron (blue). C, example recording of PV interneuron, showing evidence of depolarizing block (extremely truncated APs, but which recover post‐ictally) during the ictal event. [Color figure can be viewed at wileyonlinelibrary.com]