
Figure 5. Non‐invasive Ca2+ imaging using GCaMP6f yields an accurate estimate of relative, but not absolute, firing rates in both PV and SST interneurons.
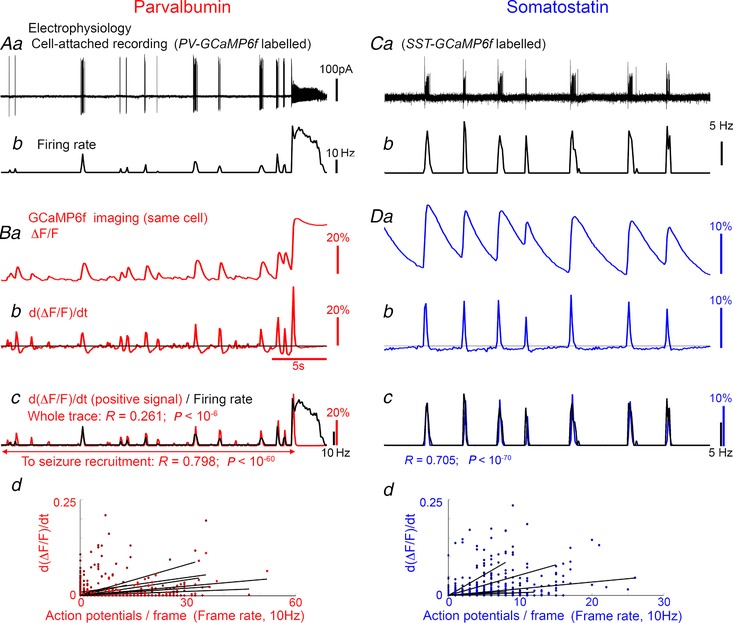
Aa, cell attached recording of a GCaMP6f‐labelled PV interneuron; b, the firing rate during each individual frame of the concurrent GCaMP6f imaging. Ba, Ca2+ imaging processing of the same cell, showing the ΔF/F min signal; b, the derivative of this signal. The positive values of d(ΔF/F)dt (above the black line in Bb) superimposed on to the electrophysiologically measured firing rate (Bc, black). Bd, all recordings (14 recordings of 9 brain slices) showed strong correlation between the instantaneous AP count and the d(ΔF/F)dt signal, although there was considerable variation in the gradient (scaling factor). C and D, example recording and firing rate for an SST interneuron (C), and GCaMP6f signal of that neuron over the same time period (D). Again, there was large variation in the gradient for the correlation between firing rate and Ca2+ signal, meaning that the pattern of firing was accurately described by the GCaMP6f, but the precise firing rate cannot be derived uniquely from the Ca2+ signal (18 recordings of 6 brain slices).