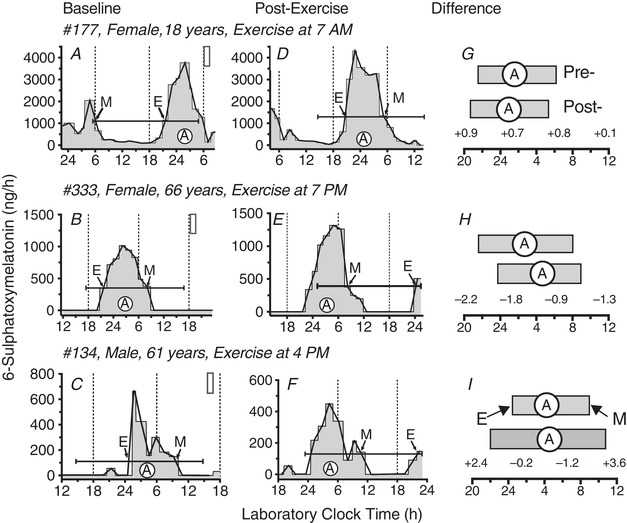
Figure 2. Example aMT6s time series.

Circadian rhythms of urinary aMT6s excretion (ng h–1) are shown for two female participants (177,133), aged 18 years (top row: A, D, G) and 66 years (middle row: B, E, H) and one male participant (134), age 61 years (bottom row: C, F, I). Grey shaded areas (histogram plots in A–F) represent aMT6s time series used for circadian phase and waveform assessment (baseline A–C; post‐exercise D–F). White filled vertical rectangles (A–C) depict the laboratory clock time of the first of the three daily 1 h exercise bouts (Fig. 1). Cosine curves were fit to the 24 h prior to the first exercise treatment and again to the final 24 h in the laboratory. Capped horizontal lines represent the mesor (cosine fitted mean, ng h–1) and 24 h time‐span of pre‐ and post‐treatment cosine fits. White filled circles (A) represent clock times of cosine acrophases (fitted peak times). Thin lines connect temporal midpoints (ng h–1) of successive collection intervals. Times of aMT6s onsets (E) and offsets (M) are identified by arrows pointing, respectively, to upward and downward crossings of the associated mesor line. Measured changes in circadian aMT6s rhythm parameters are illustrated under Difference in (G), (H) and (I), where durations of nocturnal aMT6s peaks are represented as horizontal filled rectangles (pre‐ above, post‐treatment below) that span between clock times of E and M in (A) to (F). The time Difference values for E, A and M, and change in peak duration, respectively, are listed (left to right), beneath the three post‐exercise bars, and in Table 2. All individual Difference values such as these were subsequently transformed to the normalized (corrected) circadian phase‐shift and peak duration changes listed in Table 3 and plotted in the PRCs (Figs 3, 4, 5, 6) by subtracting from each the associated mean Difference of the entire sample (Table 2 and Methods).
