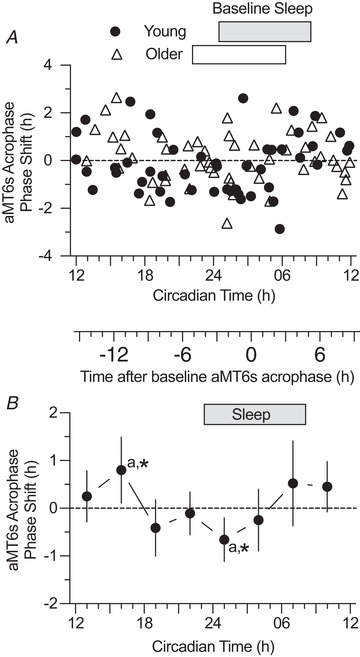
Figure 3. PRC for phase shifts of aMT6s rhythm acrophase (the peak time of the 24 h cosine fit to the ng h–1 curve, Figure 2 .

A, phase shifts induced by exercise are shown for 101 participants (closed circles, Young, n = 48; open triangles, Older, n = 53). Rectangular bars (above graph in Figs 3, 4, 5, 6) represent home‐recorded actigraphic sleep times. The ordinate displays the acrophase shift corrected for the mean phase drift (delay) across the sample. The primary abscissa represents the timing of the mid‐points of the 1 h exercise stimuli transformed (normalized) to CT by adjusting for the difference between each subject's baseline acrophase and the mean baseline acrophase of all participants (Tables 1, 2, 3). B, normalized individual phase‐shifts in aMT6s acrophase in (A) were averaged into 3 h wide bins of CT stimulus time to yield a PRC curve (mean ± 95% confidence limits) representing all subjects (Young + Older). ANOVA showed a significant time effect (F 7,93 = 2.13, P = 0.048). Phase shift means that differed significantly from each other (Tukey's post hoc test, P < 0.05) are noted with the same lowercase letters. Phase shifts that differed significantly from 0 are indicated with an asterisk. The secondary abscissa placed between (A) and (B) gives times in relation to aMT6s acrophase at baseline (where 0 is equivalent to CT 3.44).
