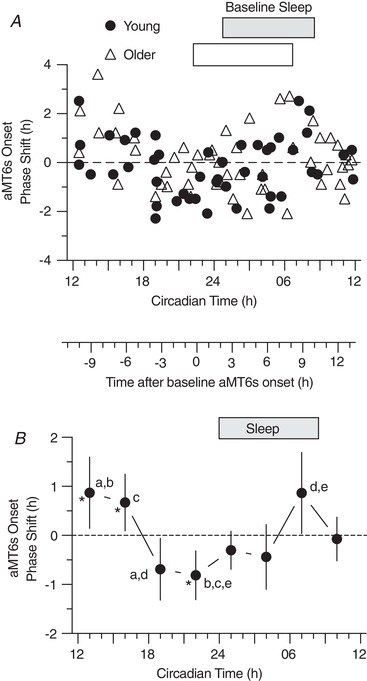
Figure 4. PRC for phase shifts of aMT6s rhythm onset (the evening rise, E in Figure 2).

A, phase shifts of aMT6s rhythm onsets (ordinate) are plotted for Young (n = 48) and Older (n = 51) participants with respect to the circadian time (CT) of exercise referenced to baseline aMT6s onset (Fig. 2 and Methods). B, the above individual phase‐shifts in aMT6s onset were averaged into non‐overlapping 3 h wide bins of CT to generate a PRC representing all phase shift responses (Young and Older groups combined). ANOVA showed a significant time effect (F 7,91 = 4.92, P < 0.001). CT bin mean shifts that differed significantly from one another are designated by shared letters (Tukey's post hoc test, P < 0.05). Mean shifts differing from zero are designated by asterisks. Both here and in Figs 5 and 6, the secondary abscissa placed between (A) and (B) gives times of exercise in relation to aMT6s onset at baseline (0 being equivalent to CT 22.62). Other conventions are as in Fig. 3.
