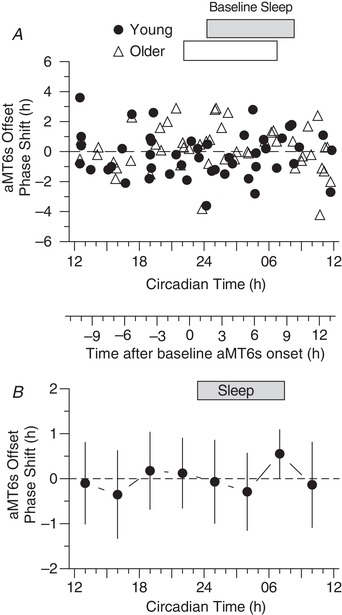
Figure 5. PRC for phase shifts of aMT6s rhythm offset (the morning decline, M in Figure 2).

A, phase shifts of aMT6s rhythm offsets (ordinate) are plotted for Young (n = 48) and Older (n = 49) participants with respect to the normalized CT of exercise referenced to baseline amT6s onset (Fig. 2 and Methods). B, the above individual phase‐shifts in aMT6s offset were averaged into non‐overlapping 3 h wide bins of stimulus time (CT) to generate a PRC representing all phase shift responses (Young and Older groups combined). Other conventions are as in Fig. 4.
