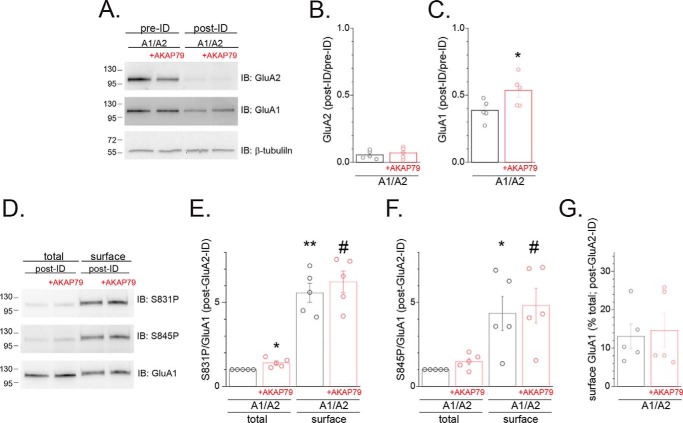
Figure 5.
AKAP79 expands the population of GluA1 subunits unassociated with GluA2. HEK 293 cells were transfected with either GluA1 or GluA1/GluA2 with or without AKAP79-GFP. Cells were biotinylated then subjected to immunodepletion with GluA2/3 antibodies. A, representative Western blots (IB) of samples from cells transfected with GluA1 with or without AKAP79-GFP prior to and following immunodepletion probed for GluA2 (top), GluA1 (middle), and β-tubulin (bottom). B, summary graph showing the post-ID/pre-ID ratio for GluA2 for multiple experiments, demonstrating effective immunodepletion of the GluA2-containing fraction. Each value was normalized for loading based on β-tubulin staining. Circles represent data from individual experiments. C, similar analysis except quantifying the post-ID/pre-ID ratio for GluA1. *, p < 0.05 compared with GluA1/GluA2. D, total (10% of input) and surface populations were isolated from the supernatants from the preceding ID assay. Shown are representative Western blots probed for S831P (top), S845P (middle), and GluA1 (bottom). E, summary graph showing the ratio of S831P/GluA1 for multiple experiments. Data for each experiment were normalized to that obtained for cells transfected with GluA1/GluA2. Circles represent data from individual experiments. *, p < 0.05; **, p < 0.01, compared with GluA1/GluA2 (total). #, p < 0.01, compared with GluA1/GluA2 + AKAP79 (total). F, parallel analysis of the S845P/GluA1 ratio is shown. *, p < 0.05, compared with GluA1/GluA2 (total). #, p < 0.05, compared with GluA1/GluA2 + AKAP79 (total). G, summary graph quantifying surface GluA1 in post-ID fractions as a percentage of total GluA1 subunits. Error bars, S.E.

