Figure 4.
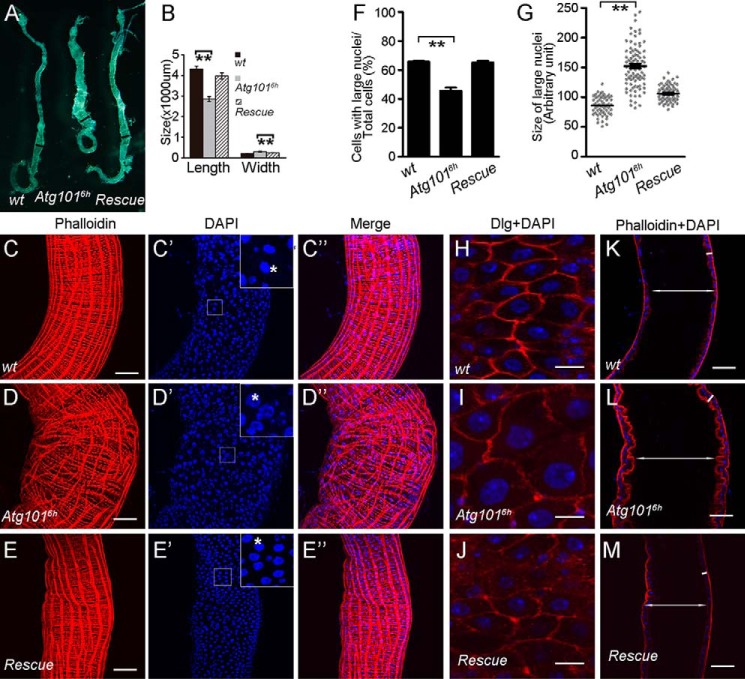
Loss of Atg101 results in adult midgut defects. A, Atg1016h mutant adult midguts are shorter and thicker than the WT control. Shown are images of midguts from adult flies with the indicated genotypes. B, quantification of the length of entire midguts and the width of posterior midguts from adult flies with the indicated genotypes. Black lines indicate the location for measuring the width of posterior midguts. 10 midguts were used for each genotype. Data are presented as mean ± S.E. An unpaired t test was used for statistical analysis. **, p < 0.01. C–E″, Z-projection confocal images of WT, Atg1016h mutant, and rescue fly posterior midguts stained for DNA (using DAPI) and actin (using phalloidin) as indicated. Top right boxed areas in C′, D′, and E′ are higher magnifications of the smaller boxed areas. Stars indicate the nuclei of EC cells. F, quantification of the number of cells with large nuclei. Cells in 18 defined regions from nine WT midguts, 18 defined regions from ten Atg1016h mutant midguts, and ten defined regions from five rescue fly midguts were counted. Data are presented as mean ± S.E. An unpaired t test was used for statistical analysis. **, p < 0.01. G, quantification of the size of the large nuclei. Sizes of 60 nuclei from six WT midguts, 90 nuclei from nine Atg1016h mutant midguts, and 90 nuclei from nine rescue fly midguts were measured. Data are presented as mean ± S.E. An unpaired t test was used for statistical analysis. **, p < 0.01. H–J, enlarged enterocytes in Atg1016h mutant midguts. Single-plane confocal images of WT, Atg1016h mutant, and rescue fly posterior midguts stained for anti-Dlg, which labels the cell membrane. Scale bars: 10 μm. K–M, cross-section of midgut epithelium from WT, Atg1016h mutant, and rescue adult flies. The white double-headed arrows indicate the intestinal lumen, and the white lines indicate the intestinal wall. Scale bars: 50 μm.

