Figure 3.
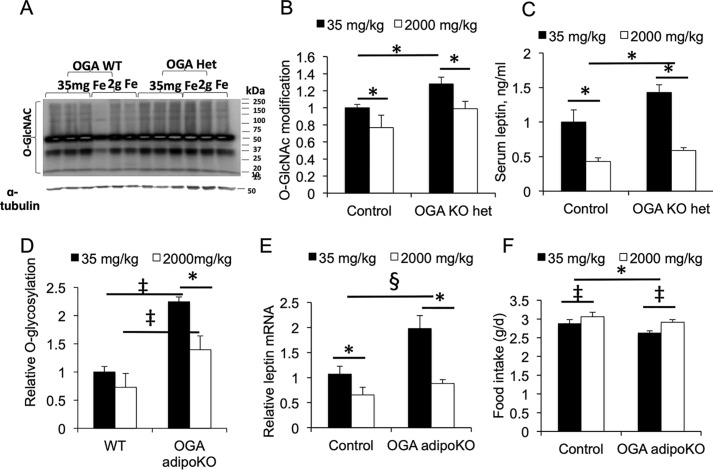
Effects of iron and genetic manipulation of OGA on leptin in mice. A, representative Western blotting for global protein O-GlcNAcylation in epididymal fat pads of WT (control) and OGA heterozygous (Het or het) KO mice fed chow containing 35 or 2000 mg/kg iron. B, quantitation of data from A, each lane normalized to α-tubulin, and all the results were normalized to WT (Control) mice on 35 mg/kg chow. C, serum leptin levels in the mice (n = 4–5 determinations/group). D, protein O-GlcNAcylation in adipose tissue of mice with adipocyte-specific deletion of OGA (OGA adipoKO) fed normal and high-iron diets and normalized to α-tubulin, and all results were normalized to WT (control) mice on 35 mg/kg chow. E, leptin mRNA in OGA adipoKO mice fed normal and high-iron diets. The results (n = 4/group) are normalized to β-actin mRNA for each determination and then normalized to values of control mice on normal iron. F, food intake (g/day) was measured for 4 weeks, beginning 8 weeks after starting diets, n = 3–4 mice/group. Shown are means ± S.E. *, p < 0.05 by ANOVA for indicated differences; ‡, p < 0.01; §, p < 0.001.

