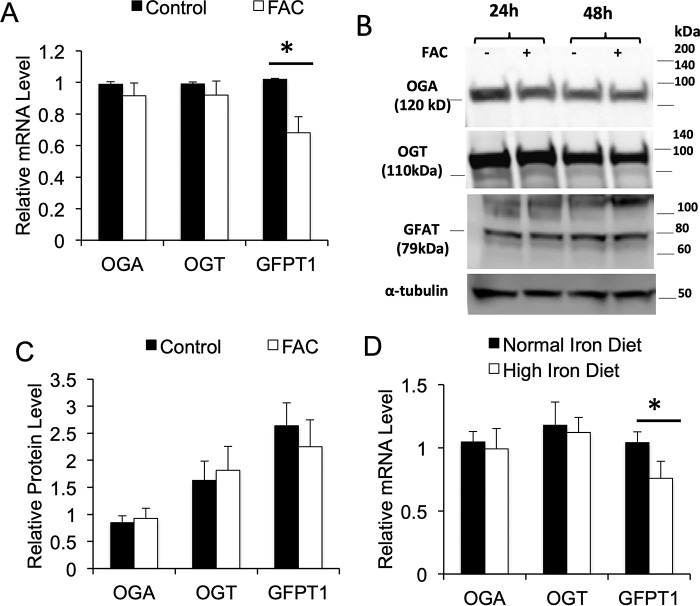
Figure 5.
Effect of iron on expression of OGT, OGA, and GFPT1. A, mRNA levels treated with or without 100 μg/ml FAC, samples normalized to β-actin and each mRNA normalized to control (n = 6–12 samples/group). B, representative Western blots for OGA, OGT, and GFAT protein in 3T3-L1 adipocytes. C, quantification of blots for OGA, OGT, and GFAT in 3T3-L1 adipocytes, normalized to α-tubulin, and expressed as relative density (n = 3–4 samples/group). *, p < 0.05. D, RNA levels in adipose tissue of WT mice fed either normal (35 mg/kg chow) or high (2000 mg/kg) iron diets, normalized to β-actin (n = 4–6 samples/group).

