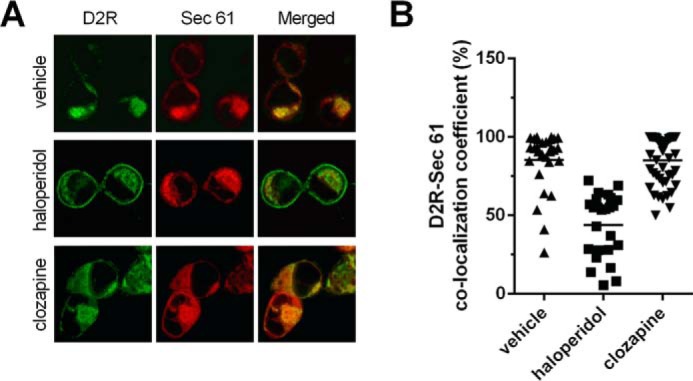
Figure 6.

Effect of haloperidol and clozapine treatments on the cellular localization of D2R. A, confocal microscopy images of cellular distribution of D2R. HEK293T cells transiently coexpressing FLAG-D2R and mCh-Sec61-β fusion, a marker for the ER, were treated with haloperidol or clozapine (10 μm, 24 h). Representative images of D2R cellular distribution (green, left column) and Sec61 cellular distribution (red, central column) and the level of D2R-Sec61 colocalization (yellow, right column) following treatment with vehicle (top row), haloperidol (central row), and clozapine (bottom row) are depicted. Each row represents confocal microscope scans of the same field. B, quantification of the extent of colocalization between D2R and mCh-Sec61-β fusion. The graph depicts the colocalization coefficient, quantified in cells coexpressing D2R and mCh-Sec61-β fusion and defined as the number of pixels positive for both D2R and Sec61, expressed as a percentage of pixels positive for D2R, after APD treatment. The colocalization coefficient of D2R colocalized with Sec61 was significantly reduced after haloperidol treatment when compared with either vehicle or clozapine treatment (n = 25–46 cells, Tukey, p < 0.001).
