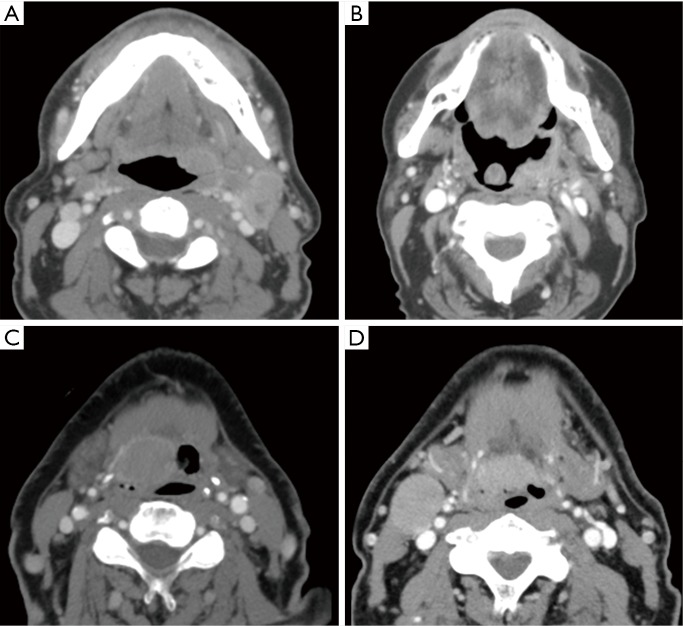
Figure 5.
Examples of CT images of oropharyngeal tumors in four different patients with their corresponding status in terms of progression versus no progression and the Radiomics Texture Analysis output result. (A) Progression correctly identified as progression with a high likelihood value of 3.63, (B) progression incorrectly identified as non-progression with a low likelihood value of 0.03, (C) no progression correctly identified as non-progression with a low likelihood value of −0.54, (D) and no progression incorrectly identified as progression with a high likelihood value of 1.05.

