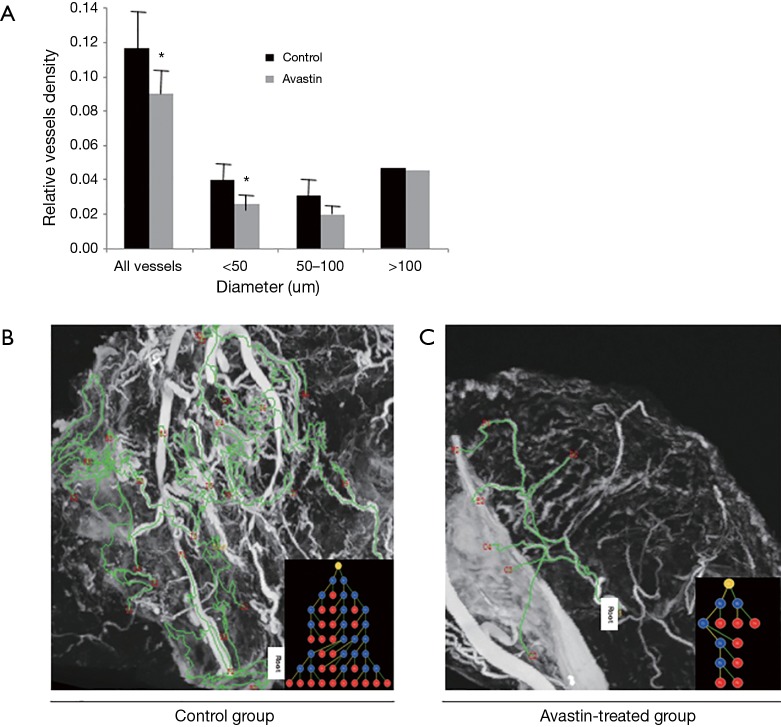
Figure 2.
Vessels density of Avastin-treated group and control group. (A) Relative vessels density analysis of Avastin-treated group and control group. *, P<0.05 versus control. Vascular tree analysis of the two groups: (B) control group (n=6); (C) Avastin-treated group (n=6). The vessel trees that had the most branches were analyzed in the two groups, and the tree analysis or branching schematics was started at the root point.

