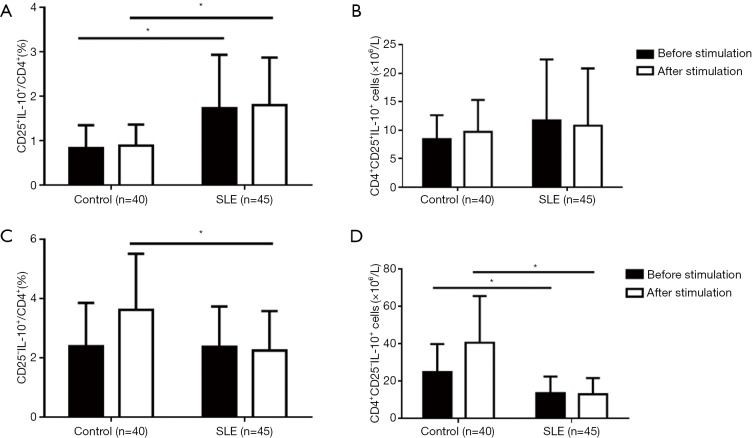
Figure 4.
Changes of IL-10-expression in the CD4+CD25+ and CD4+CD25– T subsets of SLE patients after stimulation in comparison with healthy controls. IL-10-expression was determined by flow cytometry for intracellular cytokine analysis (*, P<0.05). Compared with healthy controls, SLE patients had an increased percentage of CD25+IL-10+ cells in CD4+ T cells, regardless of stimulation presence (A,B), while decreased TGF-β+ cells in the CD4+CD25– T subset after stimulation, both in the percentage and in number (C,D).

