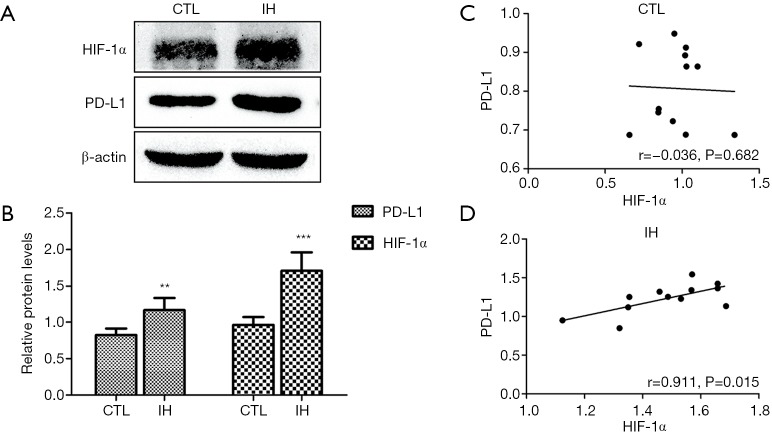
Figure 2.
Expressions and correlation of HIF-1α and PD-L1 between groups evaluated with Western blotting. Western blotting results showed that both the protein levels of HIF-1α and PD-L1 were higher in the IH group than the CTL group (A,B). A significant correlation between HIF-1α and PD-L1 was observed in the IH group (D), while the same correlation failed to be found in the CTL group (C). **, P<0.01 when compared with the CTL group; ***, P<0.001 when compared with the CTL group. Note: the HIF-1α and PD-L1 values represented in the figure are controlled by GAPDH. CTL, control; IH, intermittent hypoxia.

