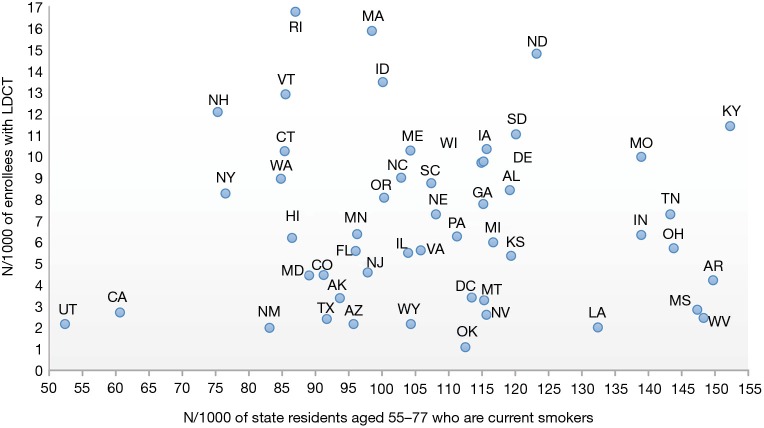
Figure 3.
Scatter plot for number of enrollees aged 55–77, per thousand, undergoing LDCT screening in 2017 vs. number of current daily smokers per 1,000 among residents aged 55–79 in 2016. BRFSS data were used to estimate daily smoking rate. The correlation between the LDCT and smoking rates was r=0.02, P=0.87. LDCT, low-dose computed tomography.

