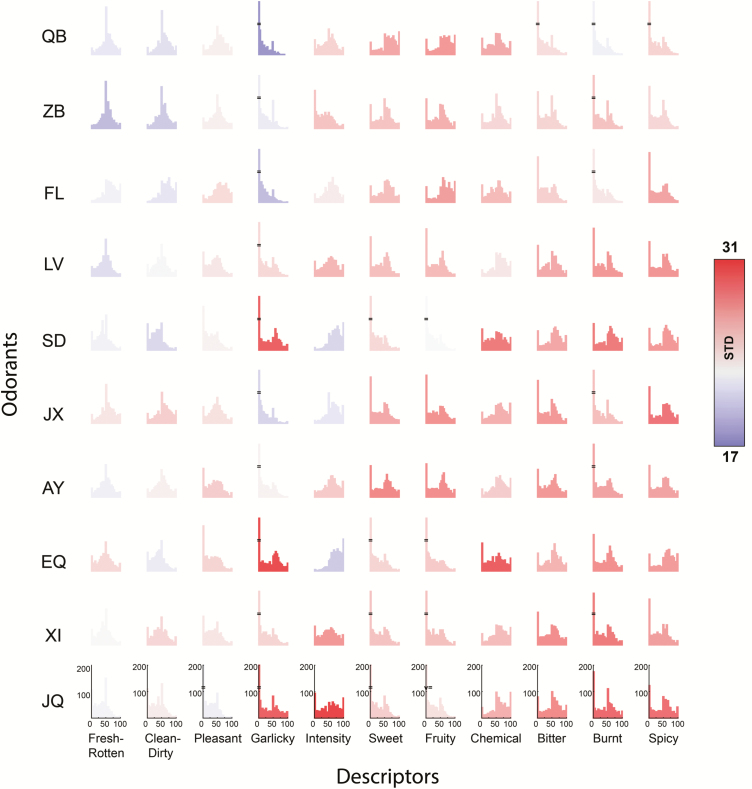
Figure 4.
Descriptors were variably applied across odorants. Histograms for each of the 11 fixed descriptors as they were applied to 10 fixed odorants. Columns arranged according to increasing average column variance (from left to right) and rows according to increasing average row variance in increasing order from top to bottom (the standard deviation is color coded). In other words, “Spicy” and “Fresh-Rotten” were the most and least variably applied descriptors, respectively, and JQ and QB were the most and least variably perceived odorants, respectively.

