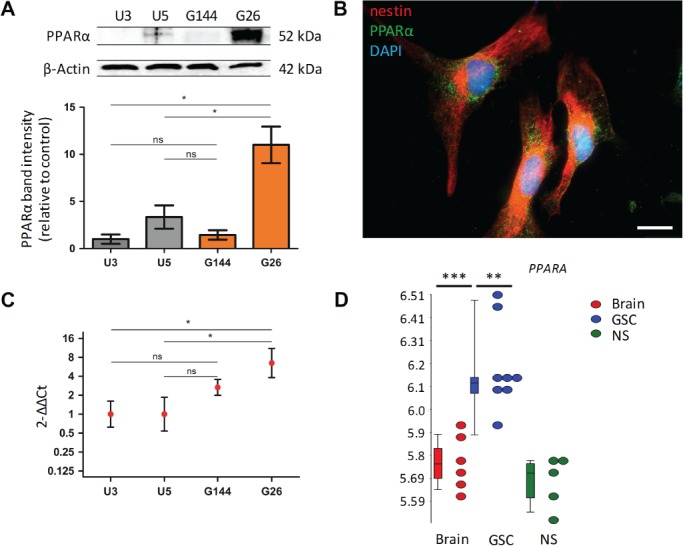
Figure 1.

PPARα protein and PPARA gene expression are increased in GSC. (A) PPARα protein expression was examined in two NSC lines and two GSC lines at three independent passages, n = 3. Protein expression values determined using densitometric analysis, with PPARα‐integrated area density values expressed relative to the loading control β‐actin values. Expression values were calculated relative to the grouped U3 control protein homogenates. Results of equivalent statistical significance were obtained when expression values were calculated relative to the grouped U5 control protein homogenates. (B) High‐power immunofluorescence microscopy showing mixed nuclear/perinuclear and cytoplasmic expression of PPARα; ×630: oil immersion. Scale bar = 25 μm. (C) PPARA mRNA expression was examined in NSC control and GSC in vitro models by RT‐qPCR, normalised to the reference genes 18S and GAPDH (not shown). Expression values were calculated relative to the grouped U3 control samples. Results of equivalent statistical significance were obtained when expression values were calculated relative to the grouped U5 control samples. The geometric mean and 95% confidence interval are shown on a logarithmic scale (to base2). n = 3 independent experiments, all samples analysed in triplicate. (D) PPARA expression in GSC (G166, G174, G179, G144, GliNS) versus NSC versus normal adult brain tissue. In the box plots, the upper and lower ‘hinges’ correspond to the 25th and 75th percentiles, respectively. The upper/lower whisker extends to the highest/lowest value that is within 1.5× interquartile range (IQR). Data beyond the end of the whiskers are outliers. Normalised and log‐transformed mRNA gene‐level summaries are shown. The test statistic was a Friedman test with Dunn's multiple comparison test (A and C) or a one‐way ANOVA (D). Error bars show SEM. *p < 0.05, ** p < 0.01; ***p < 0.001; ns, non‐significant; GAPDH, glyceraldehyde‐3‐phosphate dehydrogenase; 18S, 18 S ribosomal RNA.
