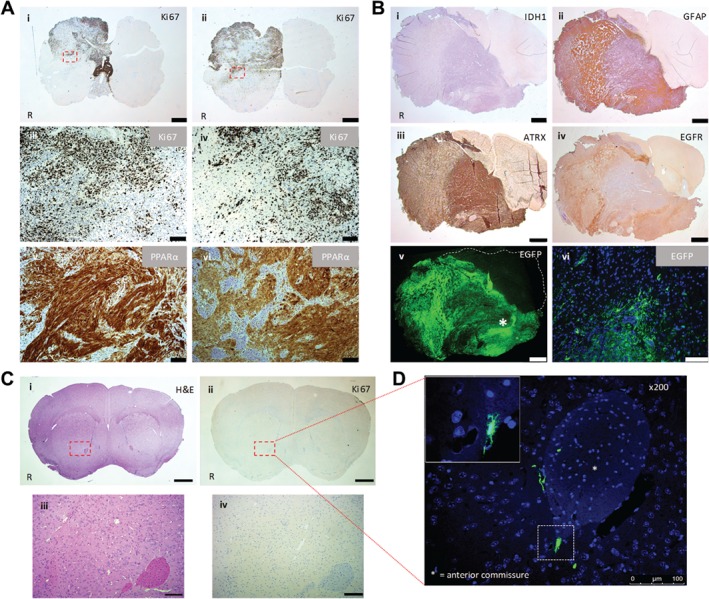
Figure 4.

SCR shRNA xenografts: IHC and IF performed on harvested mouse brains 25 weeks after GSC implantation. (A) (i–iv) Representative Ki67 IHC. (v, vi) Representative PPARα IHC. Scale bar = 1000 μm (i, ii); scale bar = 100 μm (iii–vi). (B) SCR shRNA xenograft: IHC and IF (EGFP) performed on harvested mouse brain 25 weeks after GSC implantation. Scale bar = 1000 μm (i–v); scale bar = 50 μm (vi). (C) Representative H&E image of a coronal section and Ki67 IHC performed on a consecutive tissue section. Scale bar = 1000 μm (i, ii); 100 μm (iii, iv). (D) Immunofluorescence microscopy detection of EGFP‐positive cells. The inset in the immunofluorescent image denotes the hatched area ×400. Scale bar = 100 μm. R, right hand side. Red boxes denote areas shown at greater magnification (C and D).
